Analytics Dashboard
The Analytics Dashboard gives you a clear view of how your traces are performing and what is happening with your LLM calls. It is designed to help you keep an eye on your AI agents and see how they are performing in real-time.
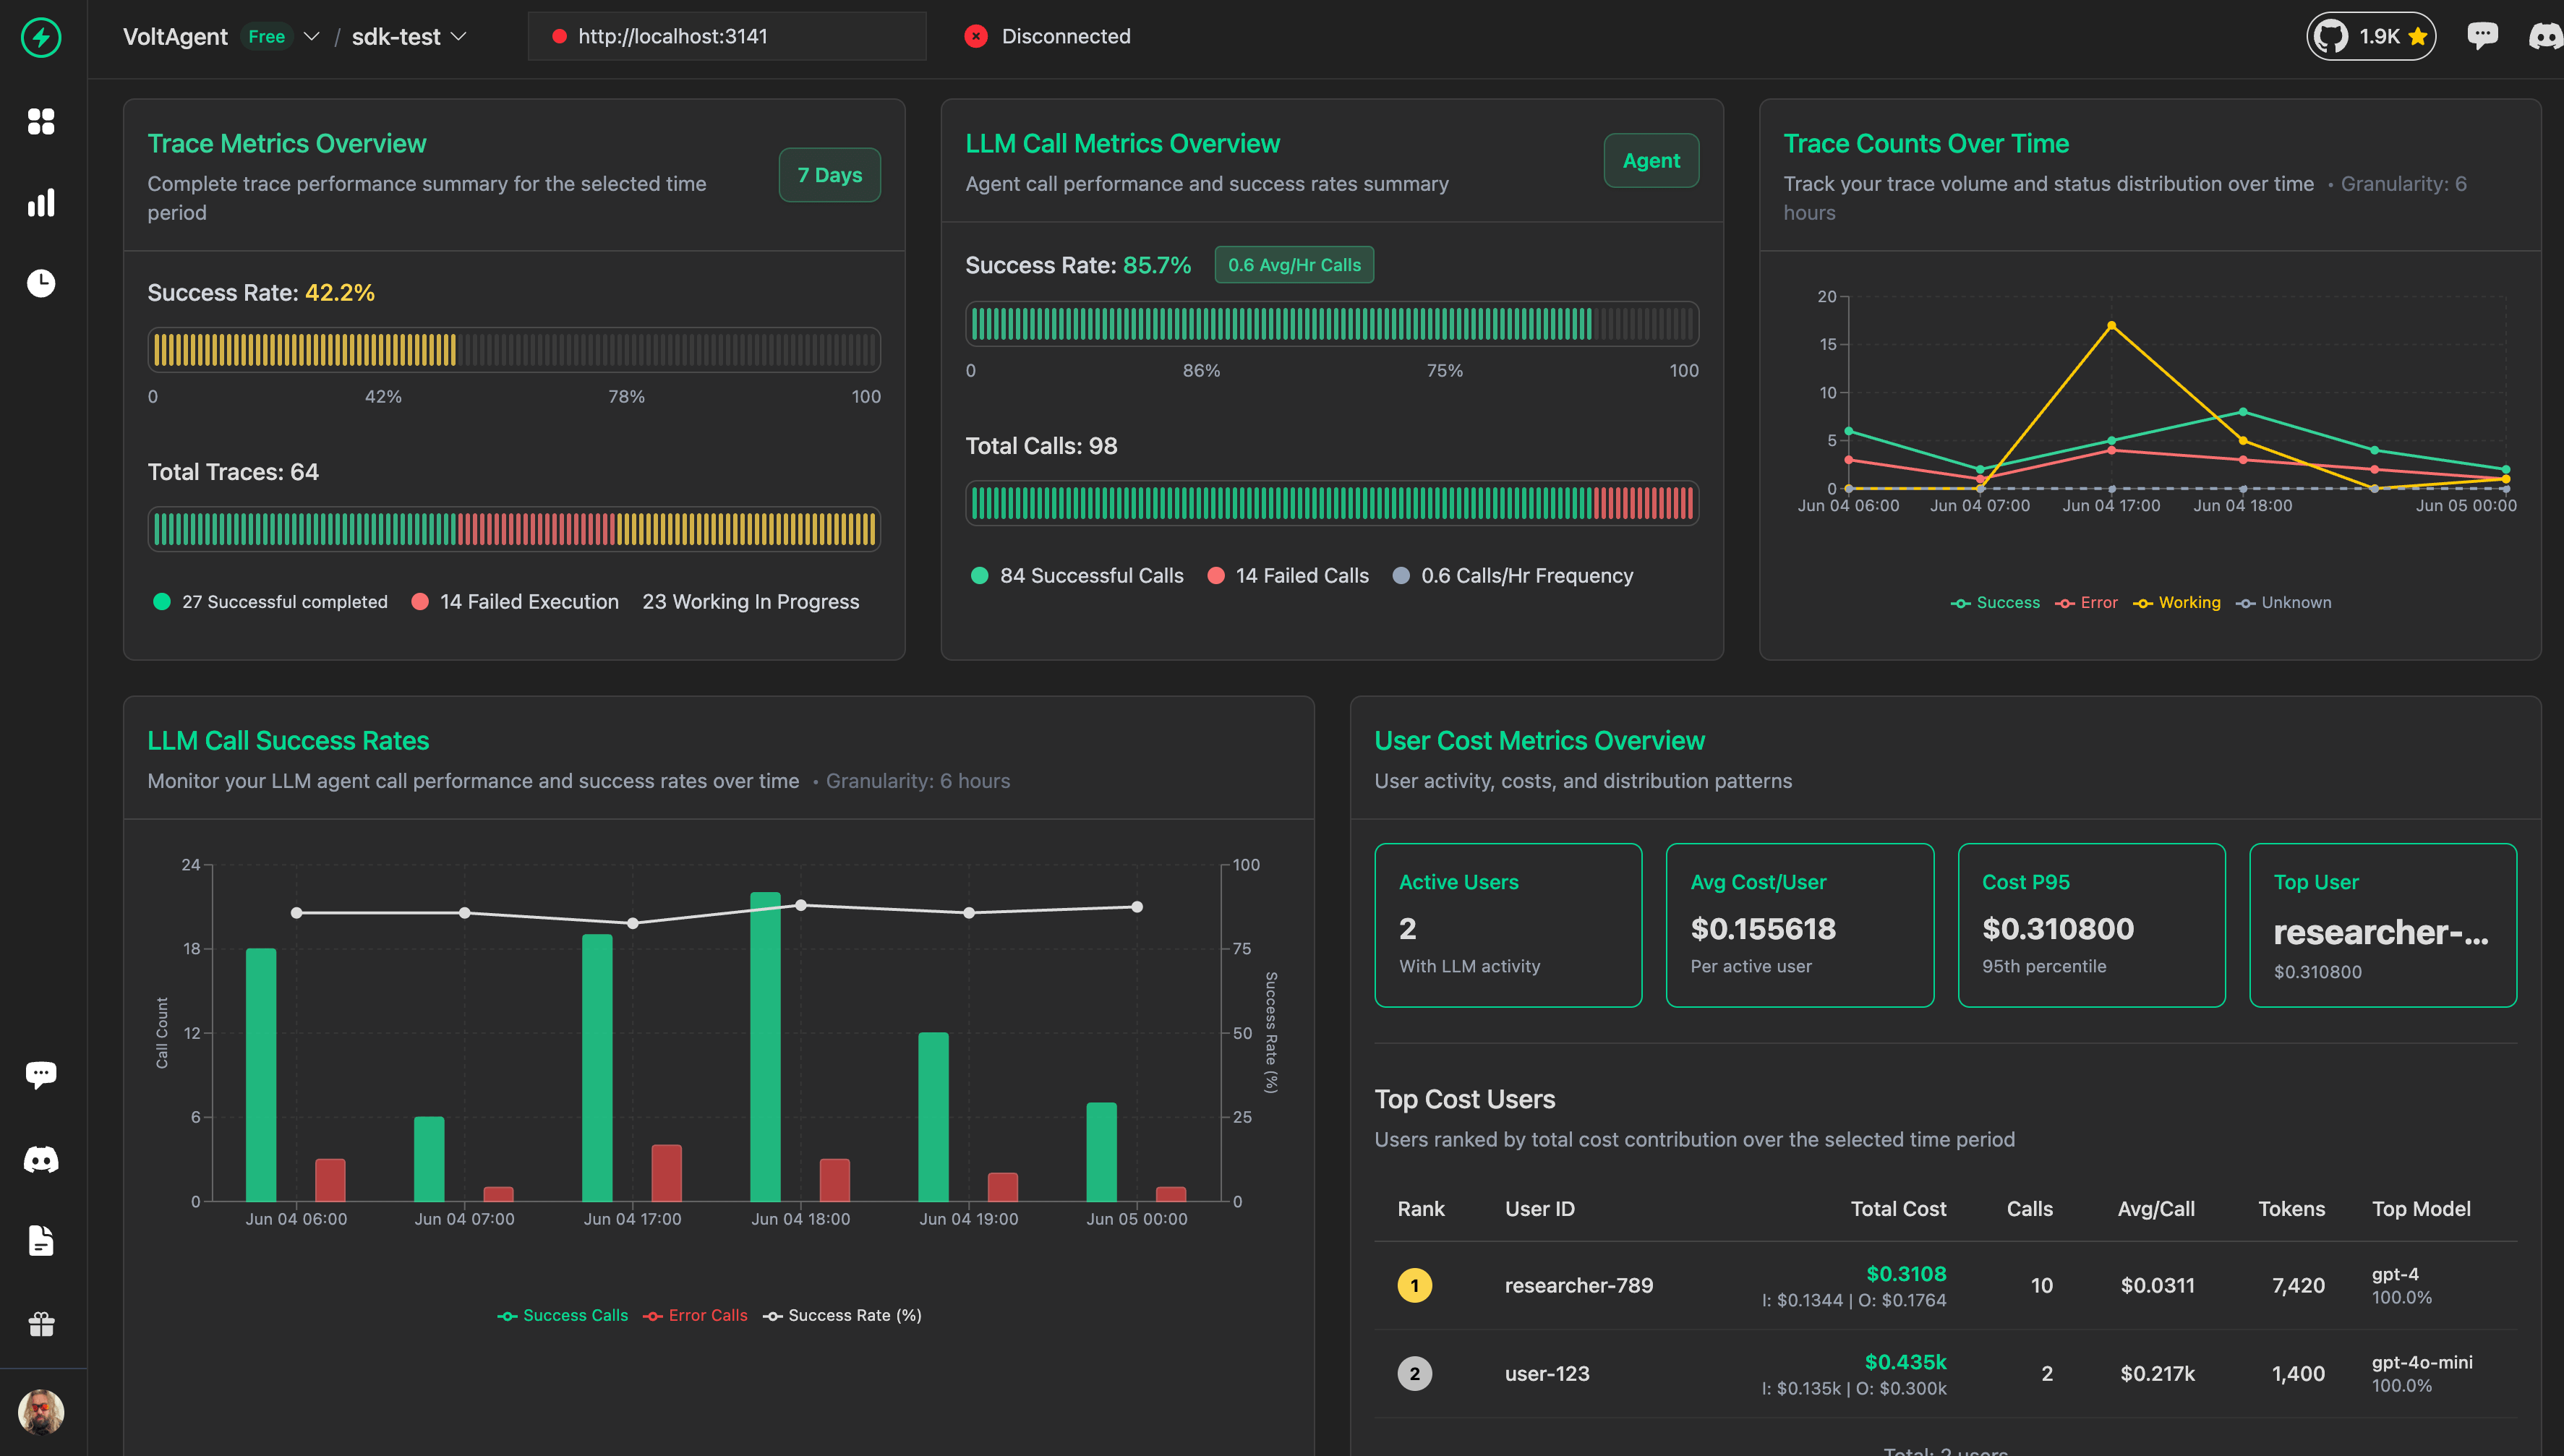
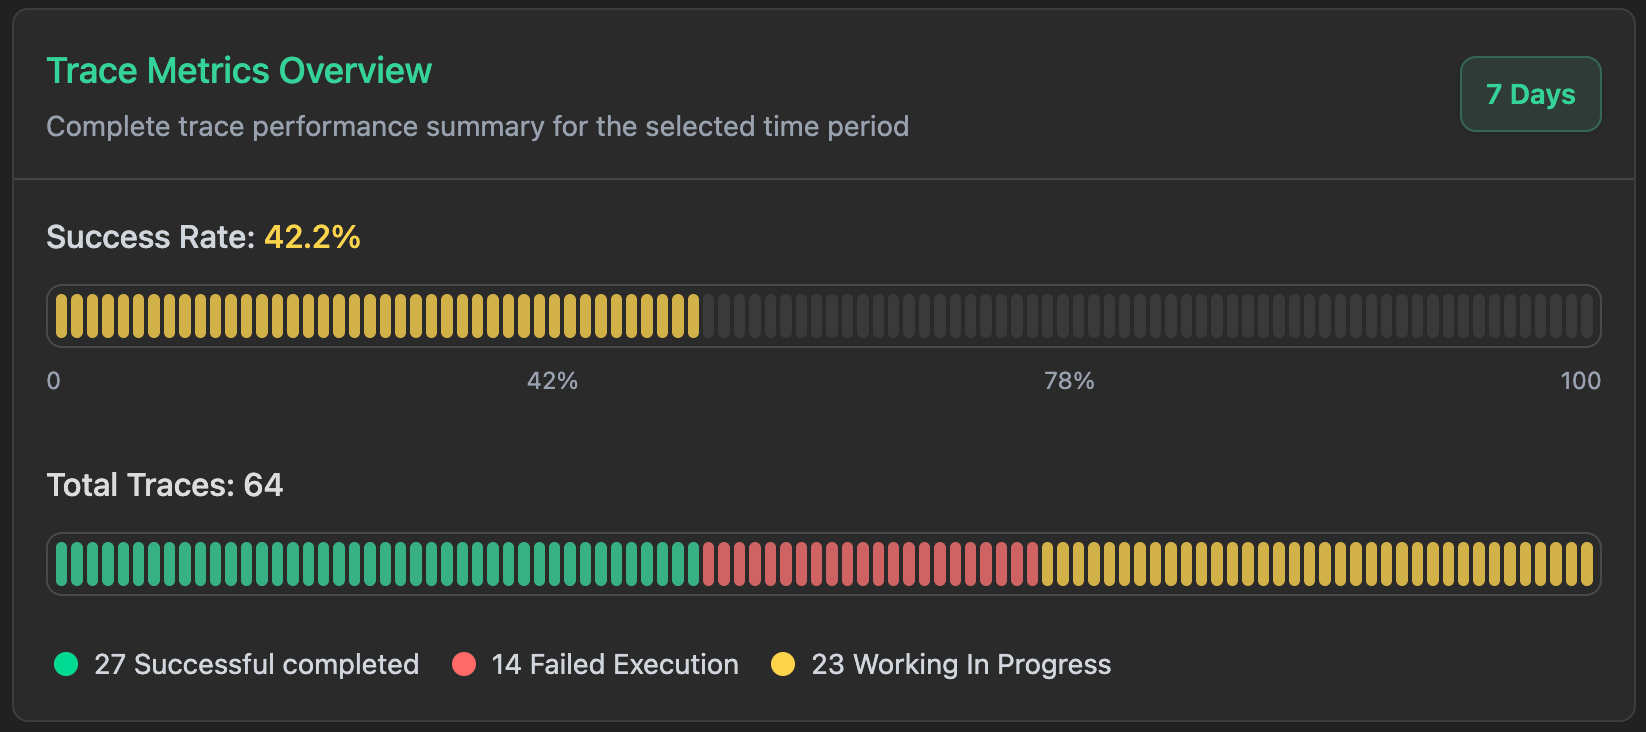
Trace Metrics
Here, it shows you all that you may want to know about your traces for whatever time period you choose.
Success Rate Analysis
This is where you can see the big picture of how your AI system is doing:
- Success Rate: It tells you what percentage of your traces actually completed successfully. It's a great way to see if your system is reliable.
- Error Rate: This tells you how many traces are not succeeding. If the number here is high, you'll have to dig further to find out what isn't working.
- Working/In Progress: The number of traces which are in the process of execution. This gives you an idea of how busy your system is at the moment.
Trace Statistics
Here, the numbers are broken down for you:
- Total Traces: The total number of all traces that executed within your chosen time period
- Successfully Completed: The number of traces completed successfully without issues
- Failed Execution: The traces that executed into errors or failed entirely
- Working In Progress: The number of traces that are in execution
This is really handy actually when you're designing for the future, making things work better, or figuring out how much people are using your AI apps.
Data Summary
This puts you in perspective about what you're looking at:
- Time Range: What time range you're looking at data for - you can set this to be specific days or weeks
- Data Points: The quantity of measurement points within your selected range
- Granularity: How often the data was recorded (e.g., every hour, every day)
This comes in handy when you're dealing with issues, reviewing performance, or building different views for different people on your team.
Key Benefits
Trace Metrics help you in several key ways:
- Track system health: You can see how your AI processes are executing and catch issues early
- Make smart resource choices: If you know your load patterns, then you can utilize your resources more effectively
- Catch issues before your users do: Catch performance issues and failures before they hit the people using your system
- Scale for growth: Look at how much volume you're doing and plan when you need to scale up
- Analyze problems: Set multiple time frames and detail levels to analyze issues when they arise
- See it all: Look at everything that's happening with your LLM operations all together The dashboard employs plain progress bars that make it easy to get an instant feel for how your traces are spread and what's generally occurring.