
"I deployed my LLM app but I have no idea what is happening!"
You've got LLM integration running, users are using it but. Why does the agent sometimes take 30 seconds to think? What do prompts actually work? Why are costs stratospheric?
That is exactly where Langfuse and similar LLM observability tools fit in.
What is Langfuse?
Langfuse is a live X-ray machine for your LLM work. Think about it; you can observe what your agent performs, which API calls fall through, which responses users detest, where your dollars are spent - you can observe everything.
Bottom line, you are not guessing anymore, you know.
Why Does This Matter So Much?
New LLM apps are complex systems. The moment users start complaining: "Bot is too slow", "Gives weird answers", "I asked the same question 3 times". it's impossible to fix these problems without observability.
With VoltAgent + Langfuse integration, you can trace everything. Just include the @voltagent/langfuse-exporter package and link it to your VoltAgent.
LLM Observability Maturity Model
Discover where you stand in your observability journey and learn what's next.
Level 1: None - Flying Blind
+Level 2: Basic - Some Visibility
+Level 3: Intermediate - LLM Aware
+Level 4: Advanced - Systematic Quality
+Level 5: Expert - Business Optimized
+Langfuse's Main Features
Tracing: Observe Every Breath Your Agent Takes

Tracing is the heart of Langfuse. All LLM calls, tool usage, even agent chat, all of it is recorded second by second.
Traces List
The first thing you see when you open Langfuse is the traces list. Every row represents a conversation or operation. The timestamp tells you when it happened, while the Name column shows what type of operation it was. On the right side, you can instantly see critical metrics like duration and cost for each trace.
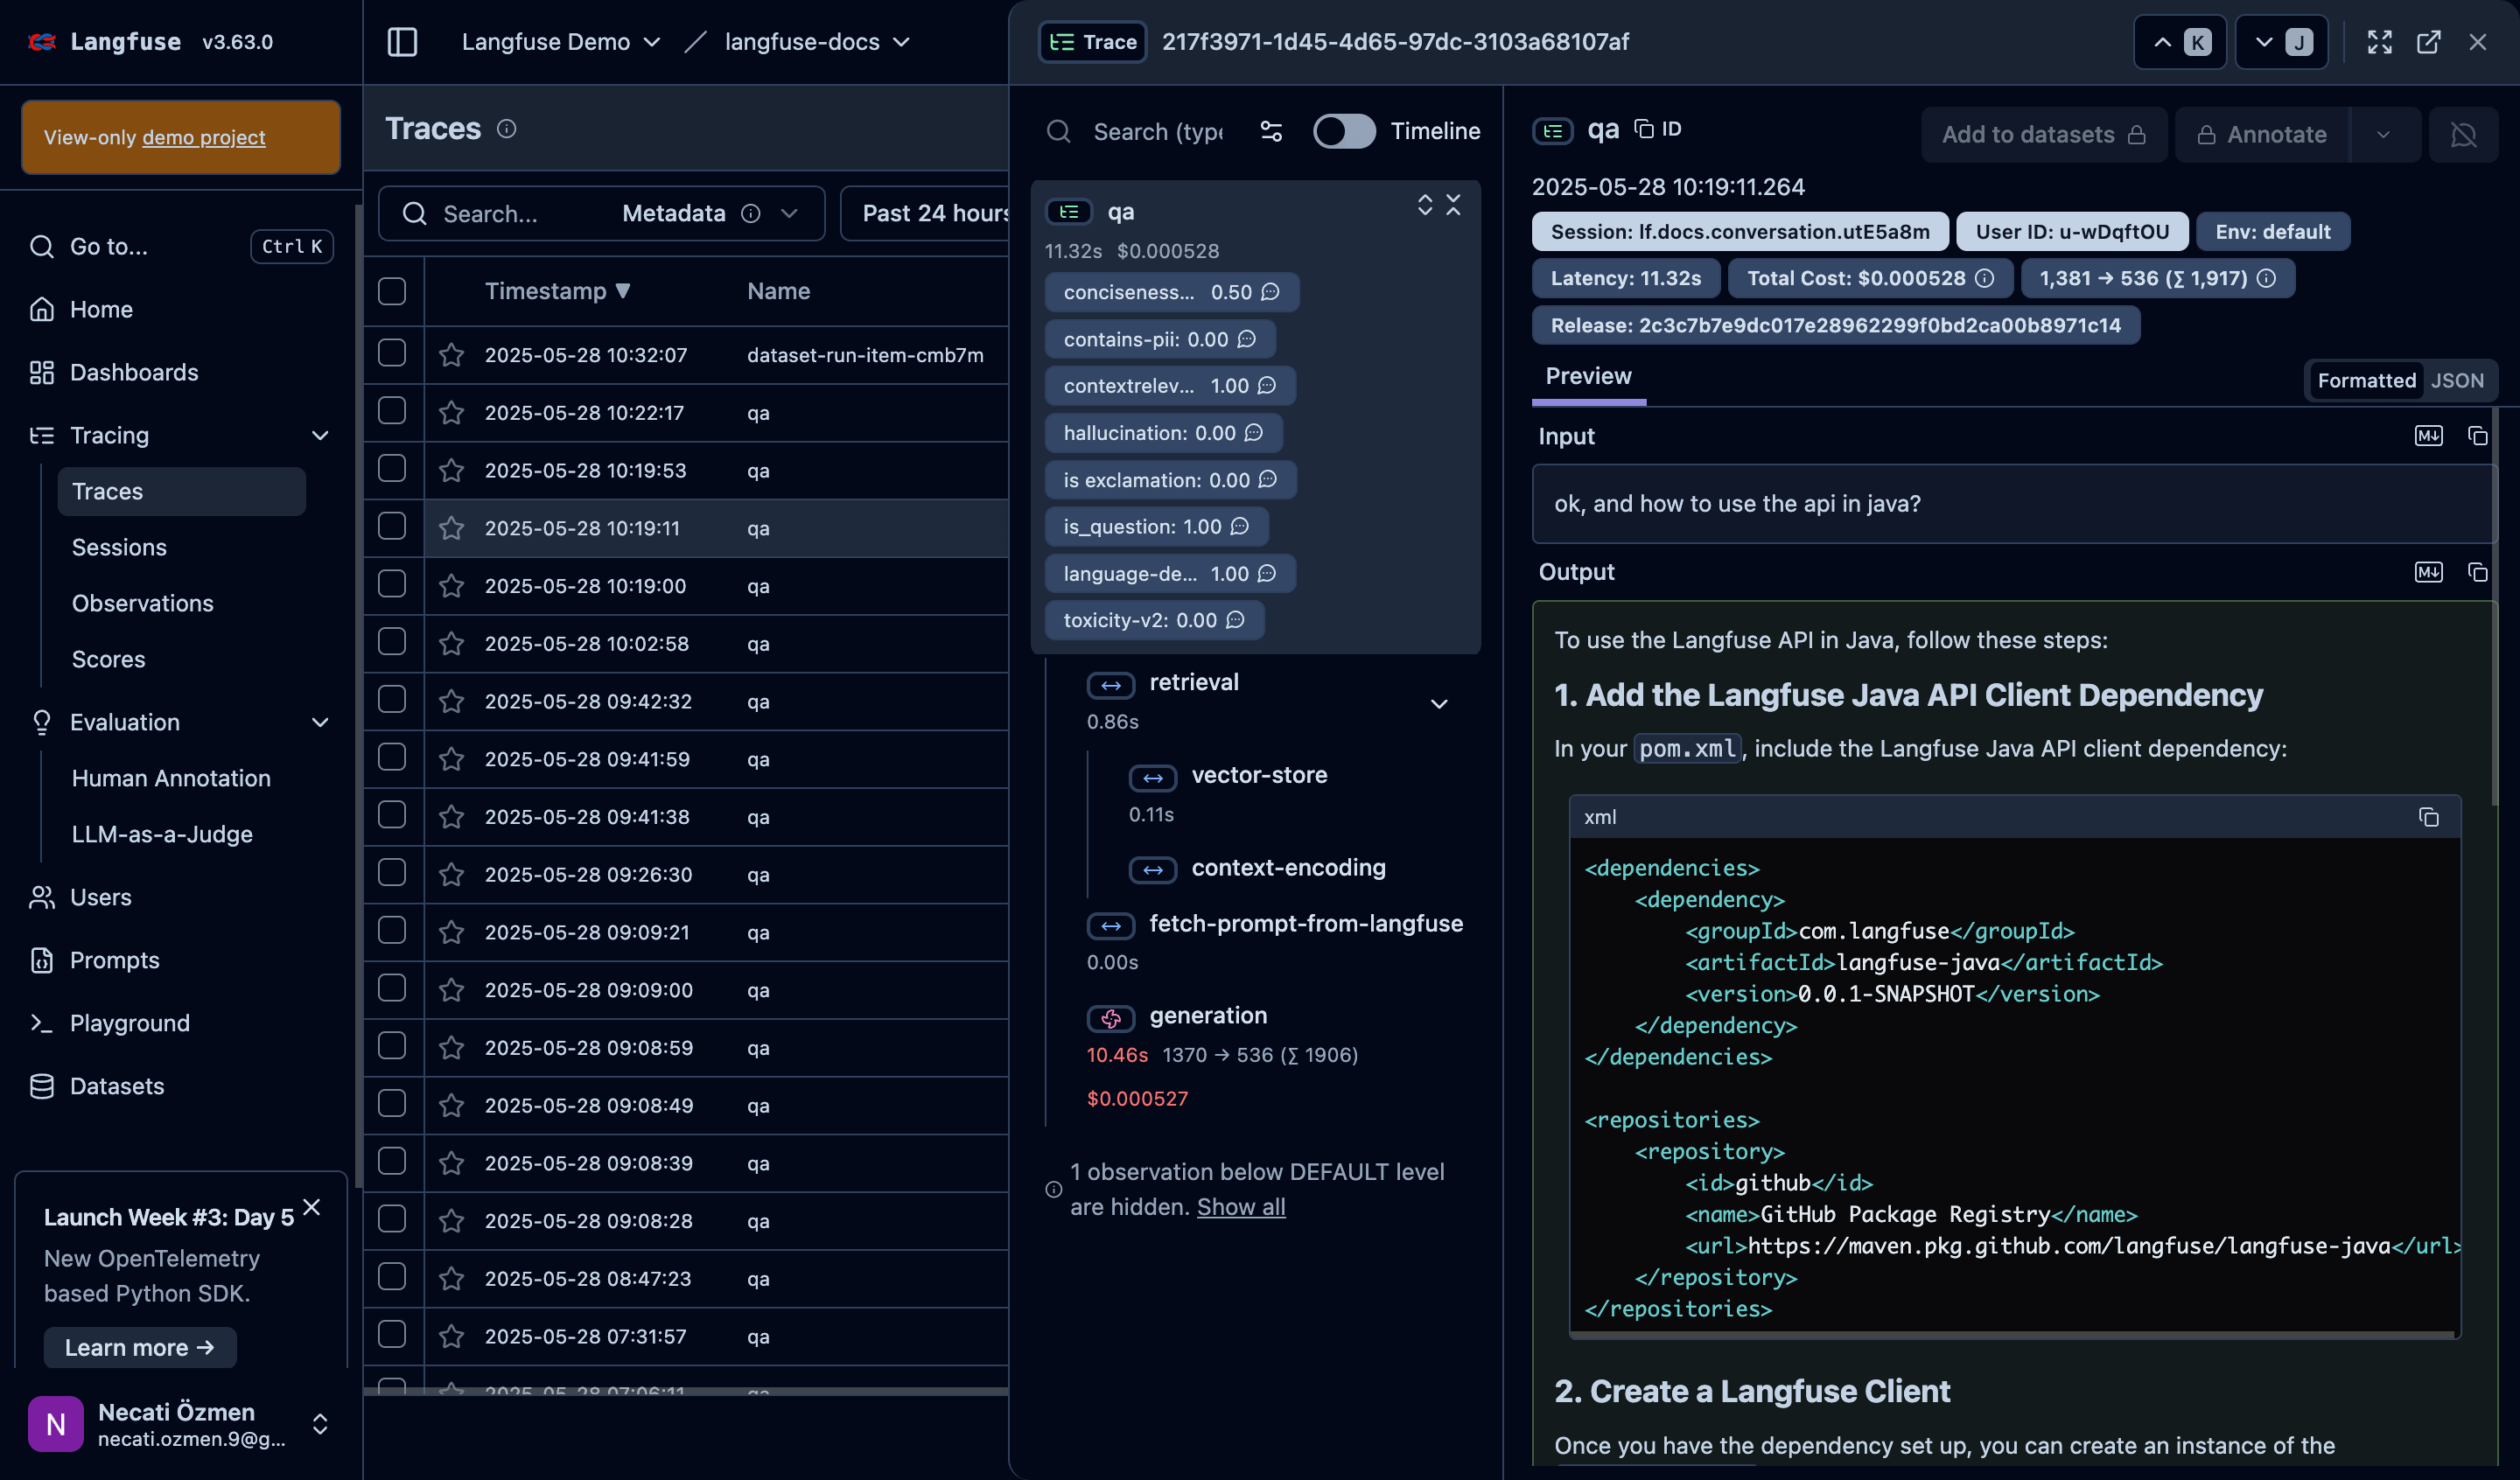
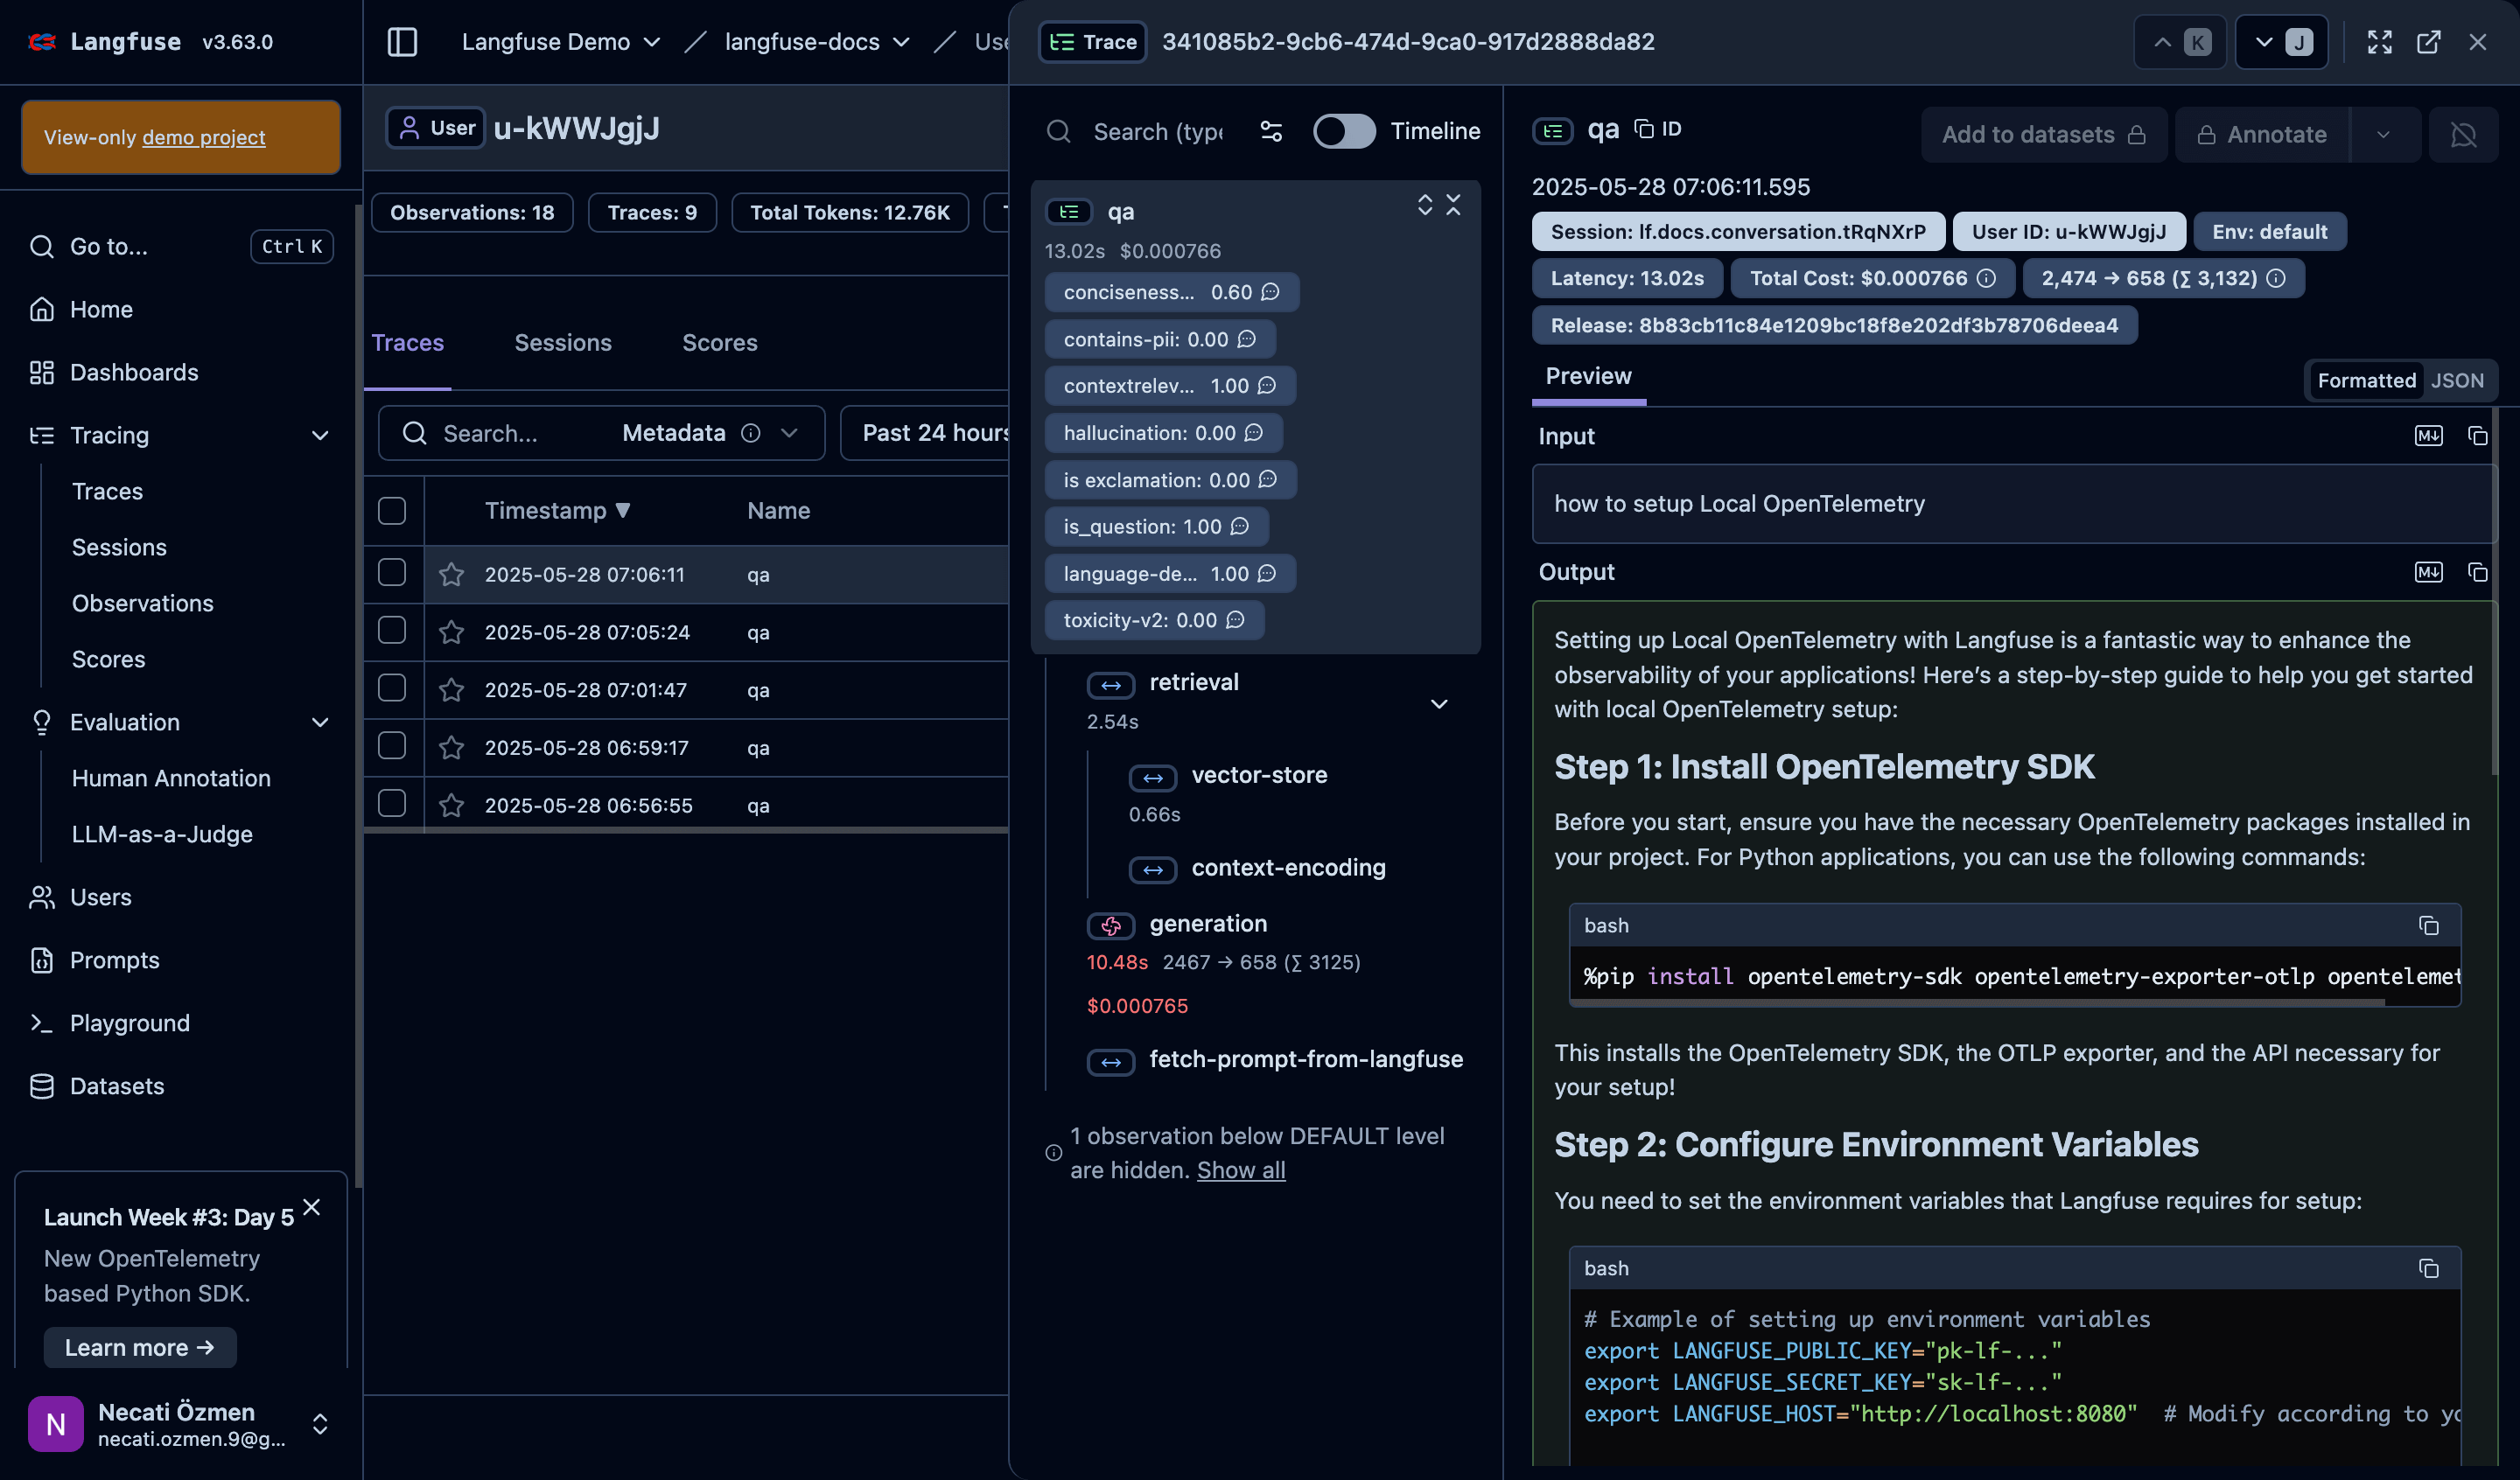
Trace Details
When you click on a trace, the magic happens. The left panel shows the trace anatomy - what components executed and their performance. You can see which parts of your system are fast and which are slow. This breakdown is crucial for identifying bottlenecks.
Right Panel - Real Conversation
The most valuable part is the right panel where you see the actual conversation. From system prompts to user questions to assistant responses - everything is preserved. This is where you understand what actually happened in each interaction.
Metadata and Performance
At the top, you get critical operational data like environment, latency, and total cost. This information helps you understand which environment might be having issues, whether response times are normal, and if costs are within expected parameters.
Timeline View
The Timeline toggle gives you a visual representation of when each component started and finished. If you have multiple processes running, you can trace them visually. This is incredibly helpful for performance debugging and understanding system behavior.
Trace Anatomy
A trace shows the entire journey from user query to response. The Root Span represents the main conversation thread. Generation Spans capture each LLM call with prompts and responses. External API calls and database queries appear as Tool Spans. Multi-agent interactions show up as Sub-Agent Spans.
What Information You Get
Each span provides granular insights. Timing data reveals duration and where delays occur. You can examine all prompt and response text. Metadata like model names, token counts, and costs are calculated automatically. User context and session data are preserved. Error messages and stack traces are captured when things go wrong.
Real Life Scenario
When a user asks "Where's my order?" you can trace the entire process:
- User query received
- Intent classification completed
- Database lookup performed ← Potential bottleneck
- LLM formats response
- Response returned to user
You can immediately identify which step is taking too long and optimize accordingly.
Nested Traces
In multi-agent systems, traces show the complete hierarchy. A top-level agent might call a research agent, which then calls a web scraper tool. You can see each level separately and understand the full interaction flow.
Evaluation: How Do You Measure Quality?
Finding the answer to "Is my agent performing well?", that's what evaluation is for.
Evaluation Scores Overview
Langfuse automatically calculates multiple evaluation metrics for each trace. You'll see scores for different criteria like conciseness, relevance, hallucination detection, toxicity, and more. These scores help you understand quality from multiple angles.
Understanding Score Meanings
Each evaluation metric has a specific purpose. Relevance scores tell you if responses actually answer the question. Hallucination scores detect when the AI makes things up. Toxicity scores ensure content safety. Language detection confirms the response is in the expected language. These automated assessments give you objective quality measures.
Component-Level Analysis
Different stages of your trace get evaluated separately. You can see how long retrieval took, how efficient vector searches were, and how much the generation phase cost. This granular view helps you optimize each component individually.
Session and User Context
The system tracks which user had issues in which session, along with environment details. This context is crucial for debugging user-specific problems and understanding usage patterns across different environments.
Input/Output Analysis
You can examine the actual conversation - what the user asked and how your agent responded. This real conversation data is invaluable for understanding where your agent succeeds or fails.
Manual Evaluation
The most straightforward approach is getting feedback from users or your team. Thumbs up/down ratings, star ratings, categorical evaluations, or open comments all provide direct quality insights. Langfuse connects this feedback to specific traces so you can identify patterns.
LLM-as-a-Judge
Using another LLM as an evaluator works well at scale. You can automatically check for factual correctness, relevance to the question, helpfulness, appropriate tone, and safety. This gives you consistent evaluation without manual effort.
Automated Metrics
Technical metrics get calculated automatically at the code level. Response time, token efficiency, tool success rates, error frequency, and cost per conversation are all tracked in real-time without any extra work.
Dataset-Based Evaluation
You can create golden datasets to validate your agent systematically. Regression testing ensures new versions don't perform worse than previous ones. A/B testing measures which prompt versions work better. Benchmark comparisons show how you stack up against competitors.
Evaluation Workflows
Langfuse can automate your entire testing process. Every new trace gets automatically scored, you get notifications when traces fail quality thresholds, weekly and monthly quality reports generate automatically, and model performance trends are analyzed continuously.
Prompt Management: Not in Code Anymore
Prompts are the soul of LLM applications. But managing them in code is a nightmare.
Centralized prompt management saves you from deployment headaches and version confusion.
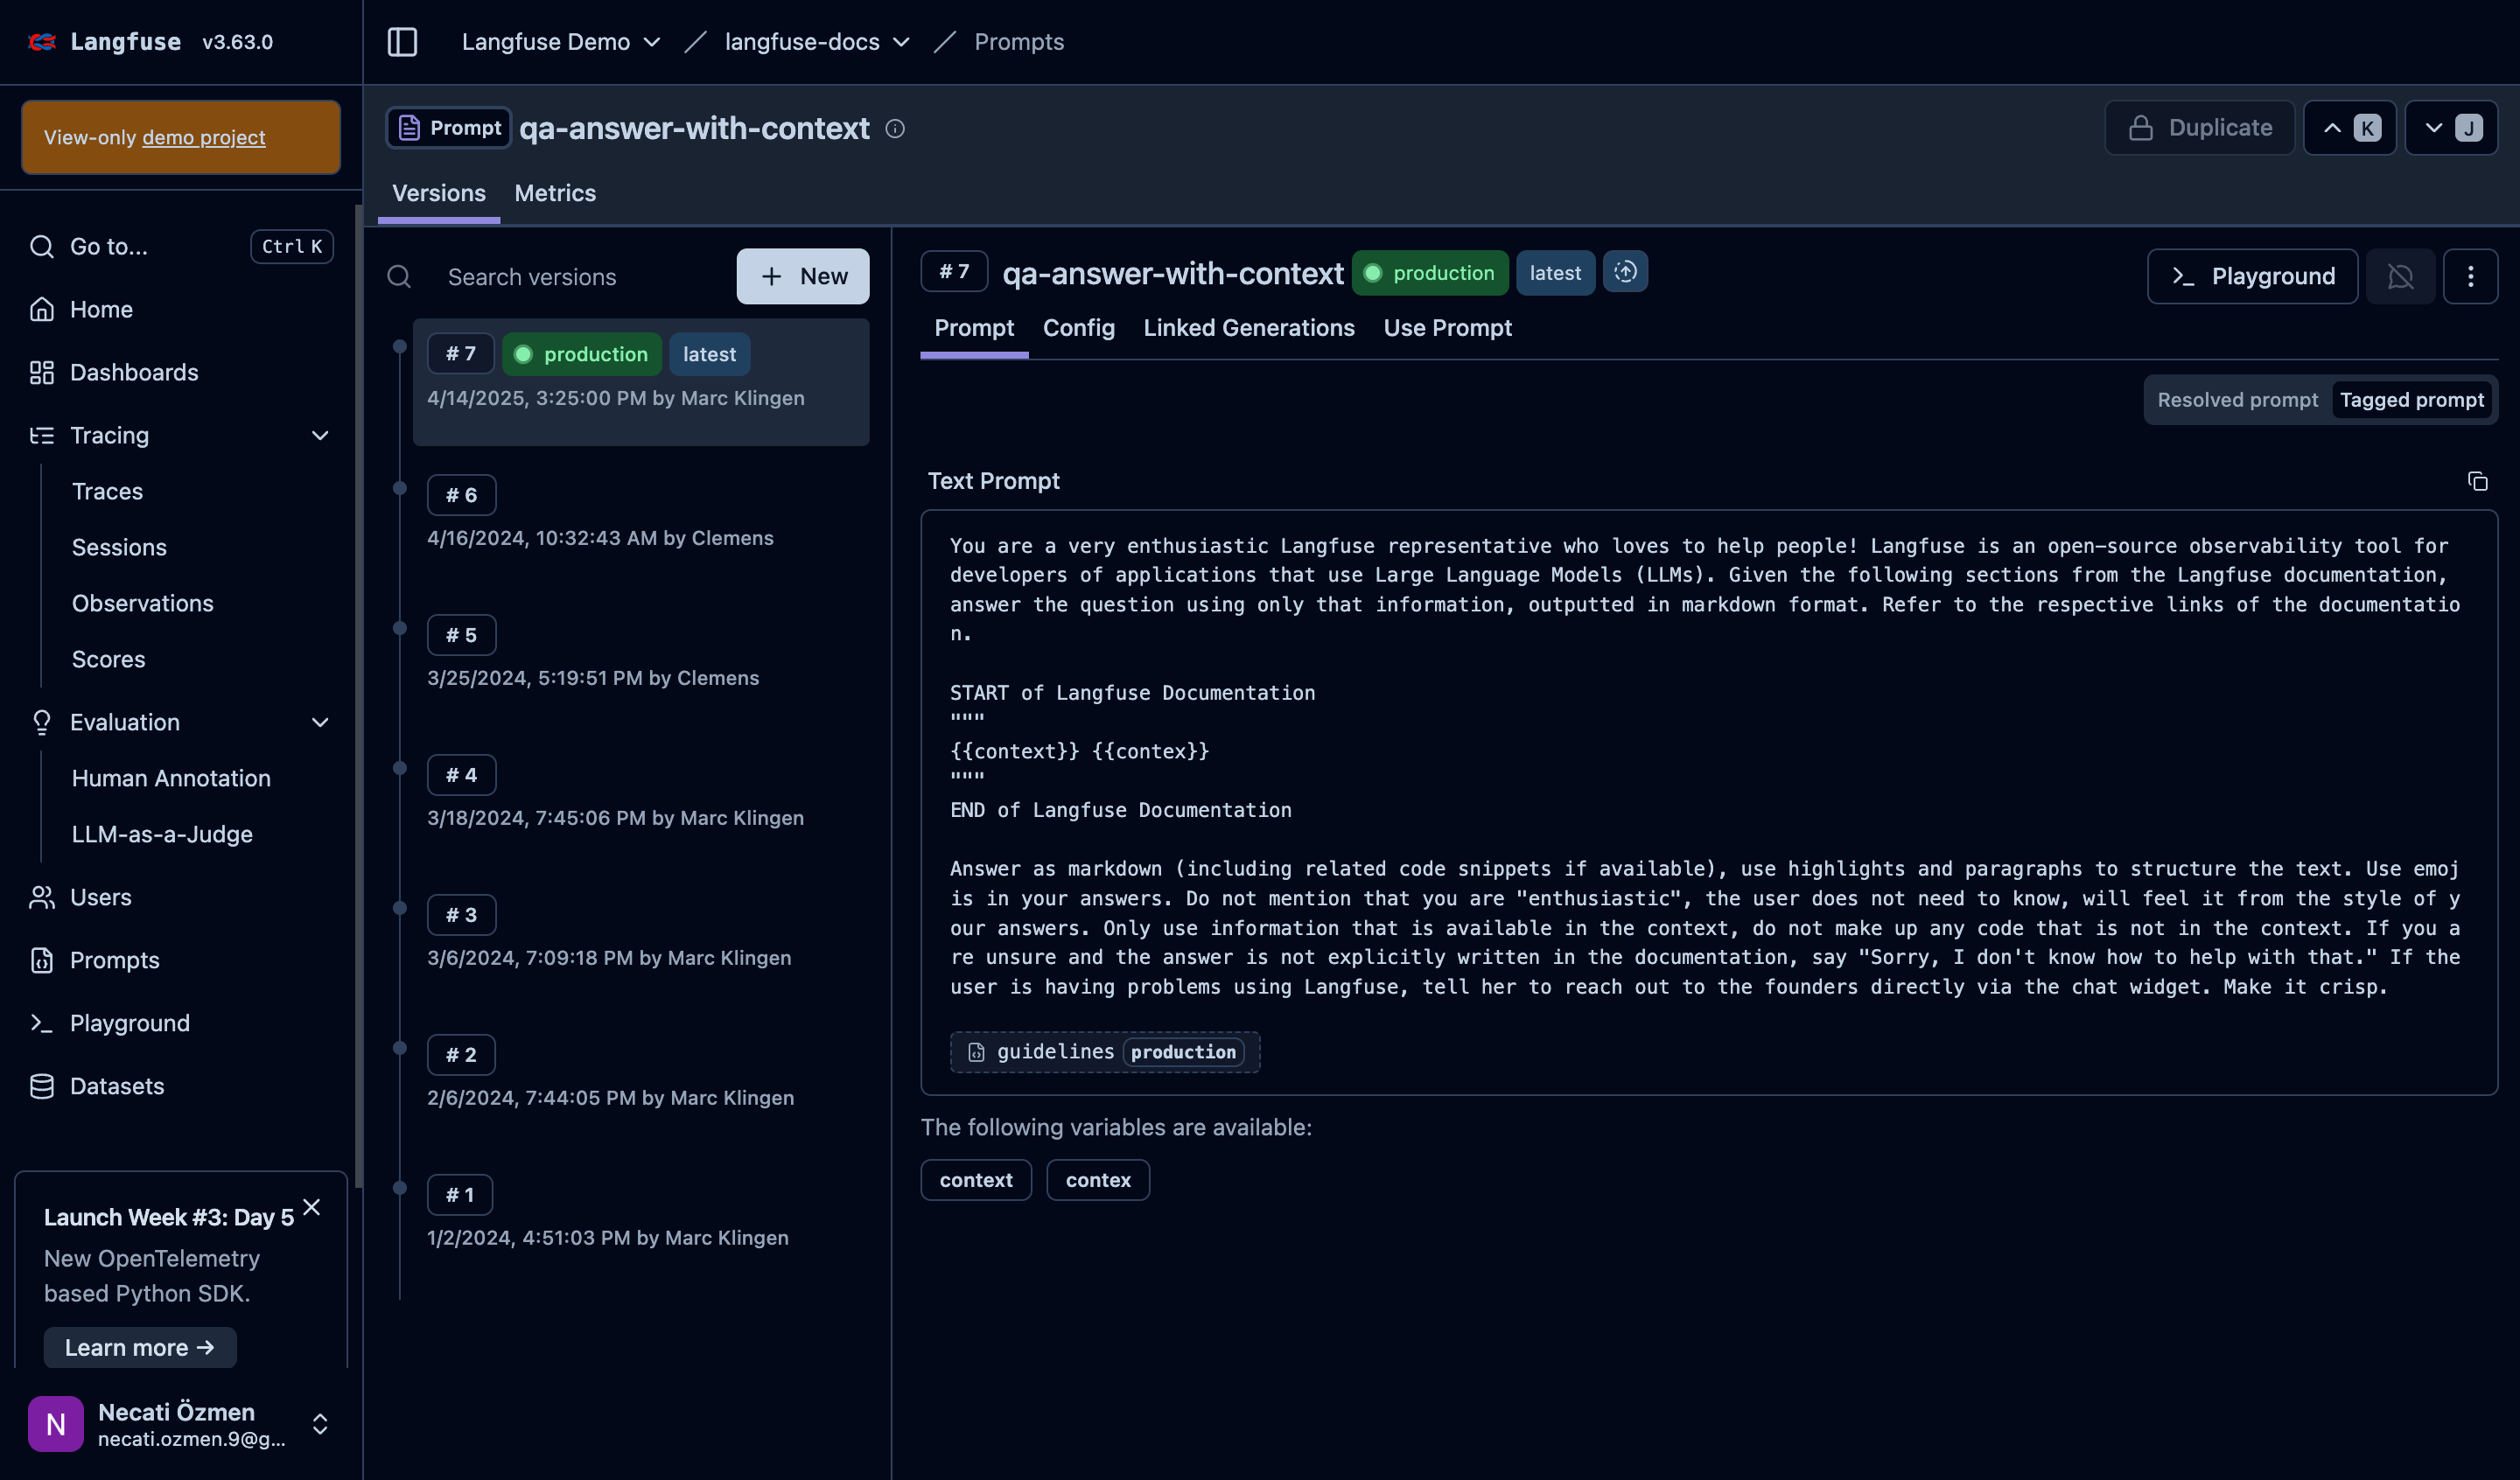
Prompt Versioning System
Langfuse tracks every version of your prompts with complete history. You can see who made changes when, compare different versions, and understand the evolution of your prompts. The latest version shows what's currently running in production.
Production vs Development
Clear badges distinguish between production and development versions. This prevents confusion about which prompt is live and which one you're testing. You can safely experiment without affecting production users.
Prompt Editor and Templates
The built-in editor lets you modify prompts with syntax highlighting and template variable support. You can use variables like {{context}} and {{user_name}} to make prompts dynamic. The system shows which variables are available and validates your template syntax.
Detailed Prompt Content
You can view the complete prompt text with all instructions, formatting requirements, and behavioral guidelines. This centralized view makes it easy to understand exactly how your agent is instructed to behave.
Playground Integration
The integrated playground lets you test prompts immediately with different inputs. You can see how changes affect responses before deploying to production. This rapid iteration cycle speeds up prompt development significantly.
Prompt Organization
Different tabs help you organize prompt information, the actual prompt text, configuration settings, linked generations showing how it's being used, and usage instructions for your team.
Centralized Management
All your prompts live in one place with complete version control. Every change is tracked and reversible. You can create branches for different use cases and roll back problematic versions instantly. Access controls determine who can modify which prompts.
Template System
The robust template system handles dynamic content elegantly. Variable substitution works with user data, conditional logic adapts instructions based on context, nested templates let you reuse common components, and multi-language support handles international users.
A/B Testing
Measuring prompt impact is crucial for improvement. Traffic splitting lets you compare old vs new prompts with real users. Statistical significance calculations tell you when results are meaningful. Auto-winner selection can automatically promote better-performing prompts. Gradual rollouts minimize risk during updates.
Prompt Analytics
Detailed analytics track how each prompt version performs. Success rates show effectiveness, response times reveal performance impact, token usage calculates cost implications, and user satisfaction measures real-world quality.
Collaboration Features
Team features streamline prompt development. Comment systems enable quick discussions about changes. Review processes ensure quality control. Change notifications keep everyone informed via Slack or email. Audit logs track who changed what and when.
Dashboard: Everything at a Glance
The dashboard is where everything comes together.
Main Dashboard Overview
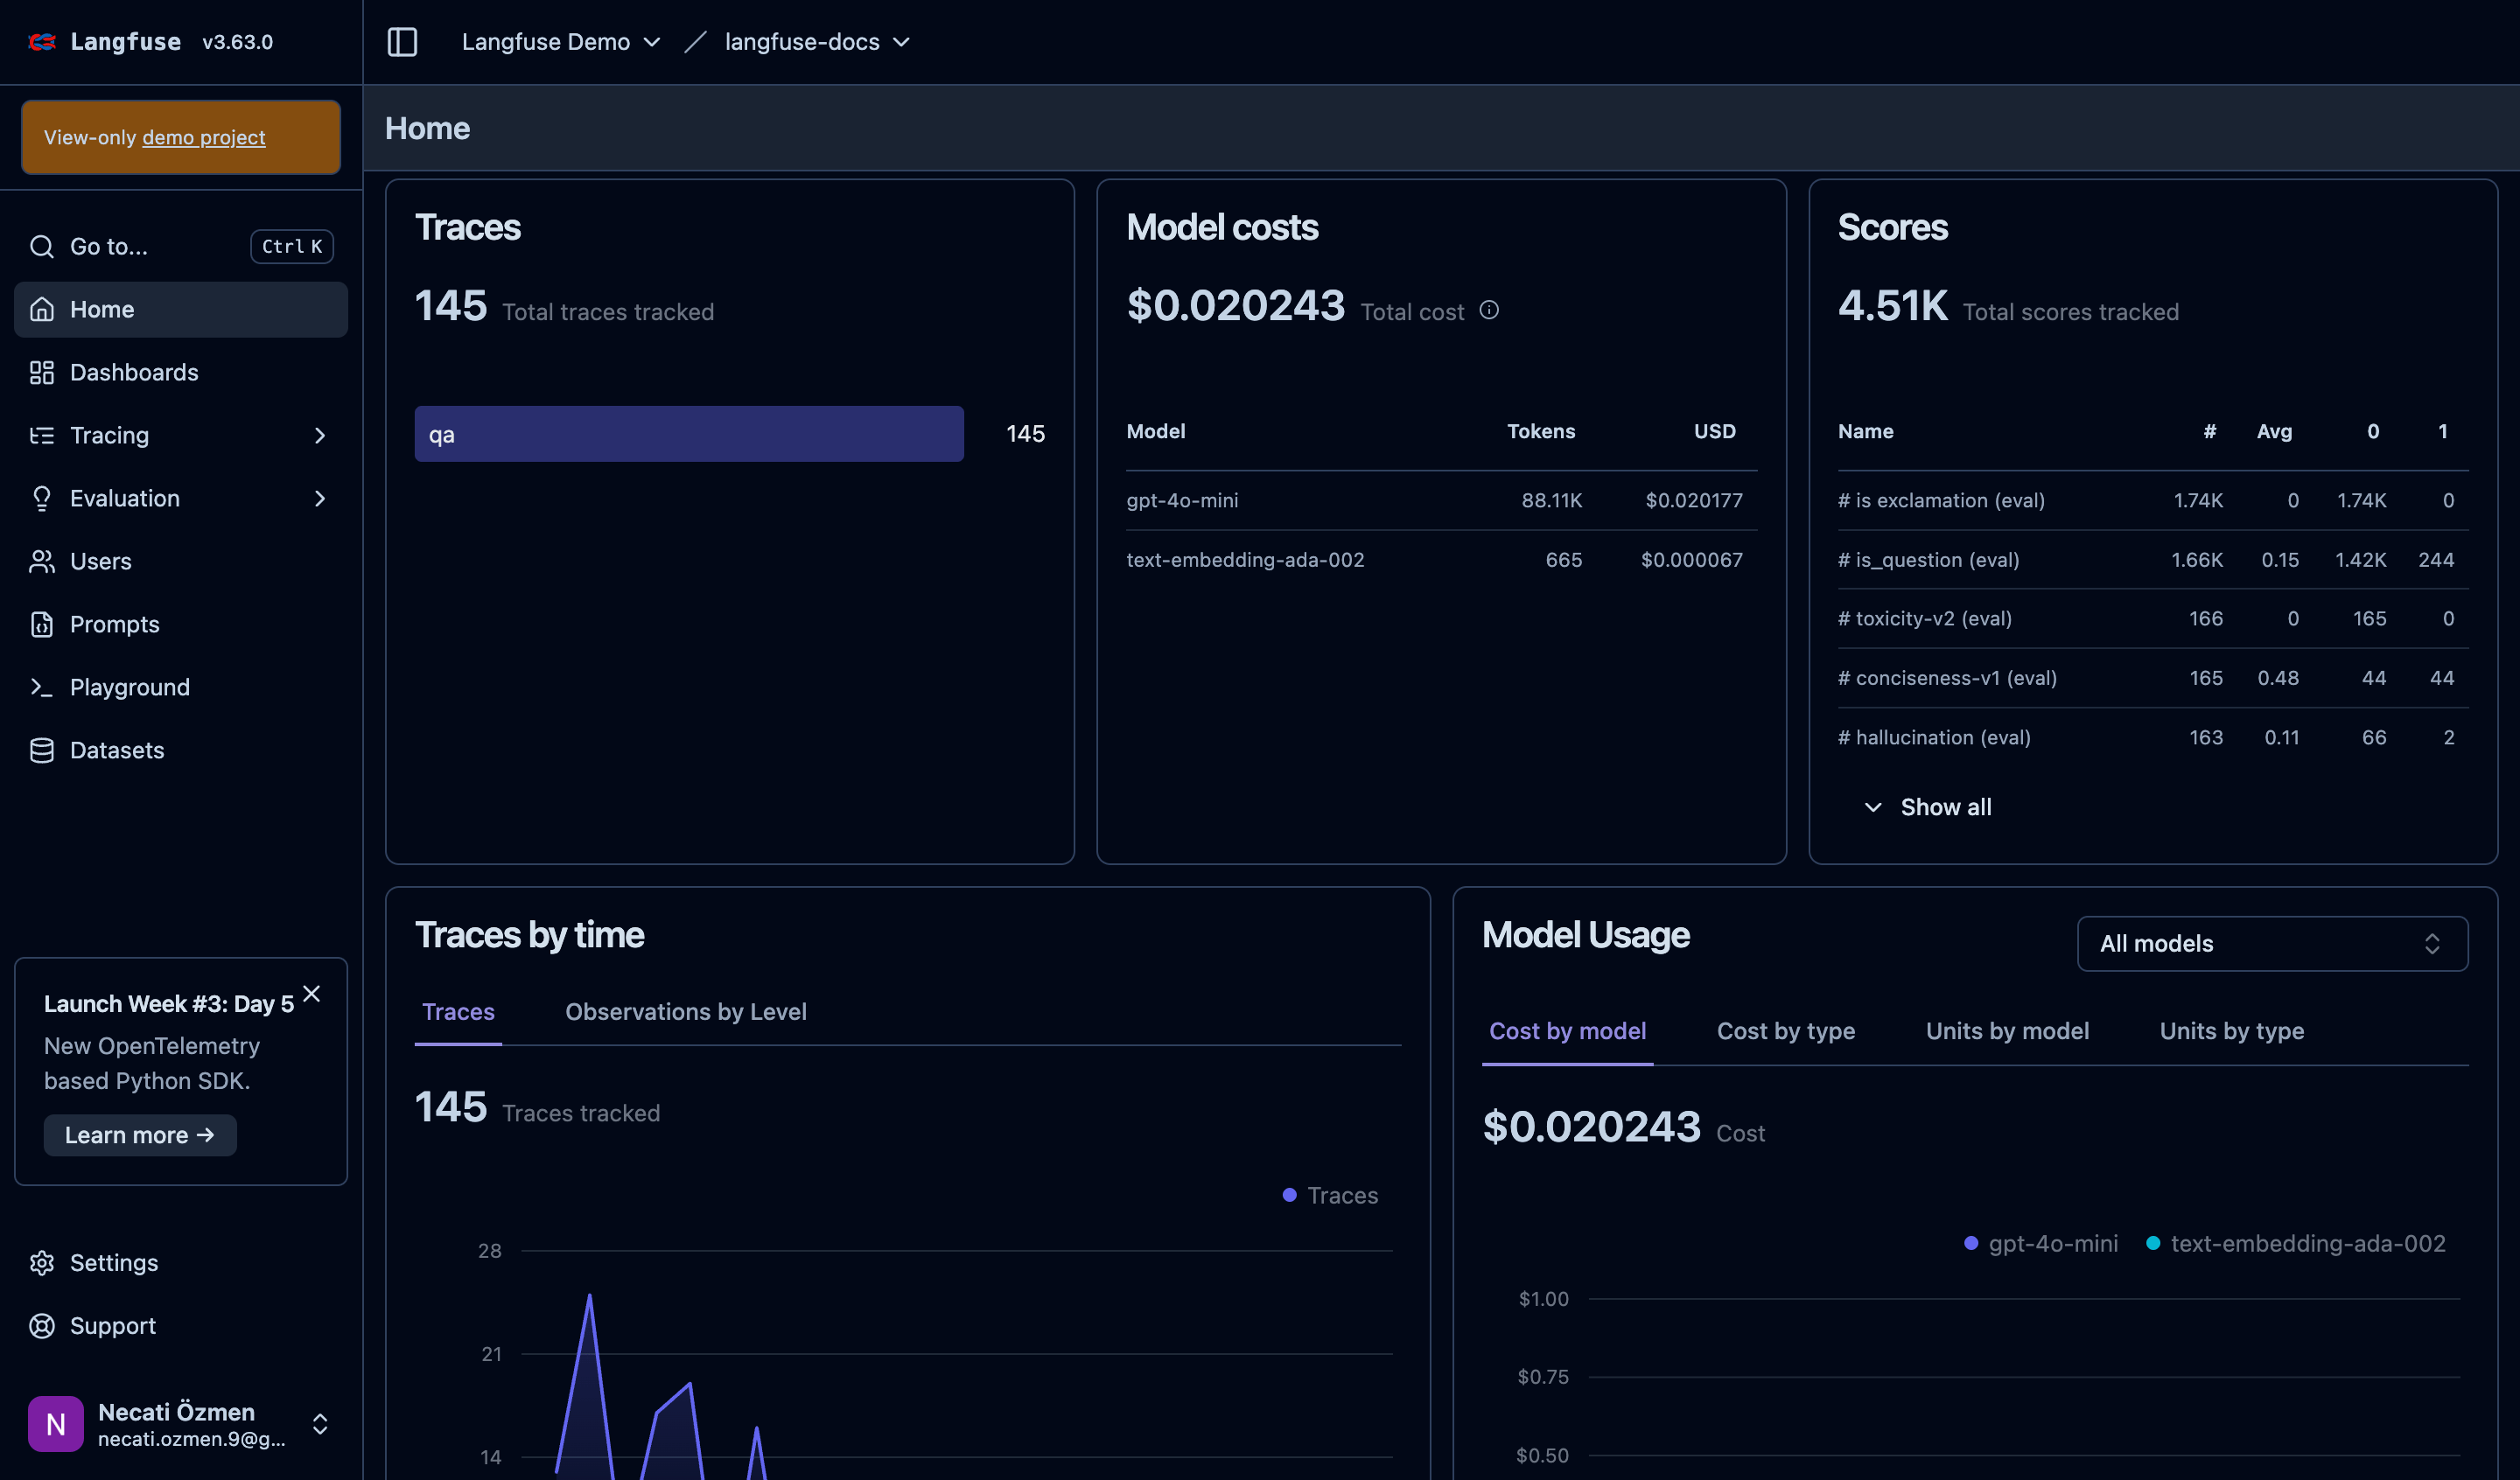
The home dashboard provides an instant snapshot of your system's health. Key widgets show total traces monitored, cumulative costs, and evaluation scores processed. These high-level metrics let you quickly assess overall system performance.
Traces Monitoring
The traces widget shows your system's activity level and categorizes different types of operations. This helps you understand usage patterns and identify which parts of your system are most active.
Cost Analysis
Cost tracking is absolutely critical for LLM applications. The dashboard breaks down expenses by model, showing token usage and associated costs. You can immediately identify which models are driving your expenses and optimize accordingly.
Quality Scores Dashboard
The scores widget aggregates all your evaluation metrics. You can see how many assessments have been performed across different criteria like toxicity, relevance, and accuracy. This gives you a comprehensive view of your system's quality.
Time-Based Analysis
Graphs show how traces are distributed over time, helping you identify usage patterns, peak hours, and potential issues. Understanding temporal patterns is crucial for capacity planning and performance optimization.
Model Usage Breakdown
Detailed model usage statistics help you understand which AI models you're using most and their relative costs. You can filter by different criteria and view data from multiple perspectives to optimize your model selection.
Real-Time Monitoring
Live statistics update continuously, showing current system load, traffic volume, response speeds, error rates, and spending velocity. This real-time visibility enables immediate response to issues.
Historical Trends
Trend analysis over time reveals whether your system is improving or degrading. You can track usage growth, performance changes, quality evolution, and cost optimization effectiveness.
Segmentation & Filtering
Multiple data views help you analyze different user segments, geographic regions, agent performance, and usage patterns. This segmentation reveals insights that aggregate data might hide.
Custom Dashboards
Role-specific dashboards serve different team needs. Developers see error rates and performance bottlenecks. Product managers view user engagement and feature usage. Business stakeholders see revenue impact and ROI calculations.
Alerting System
Automated alerts notify you of critical issues. Performance alerts trigger on slow responses, error alerts fire on high failure rates, cost alerts warn of budget overruns, and quality alerts flag declining user satisfaction.
Data Export
Export capabilities let you integrate with other systems. CSV/JSON exports, API access, webhook integrations, and BI tool connections ensure your data works with your existing analytics infrastructure.
VoltAgent + Langfuse Integration
VoltAgent + Langfuse integration is super simple. As described in our docs, you just add the @voltagent/langfuse-exporter package and attach it to VoltAgent's observability via a SpanProcessor helper.
Simple Setup
import { Agent, VoltAgent, VoltAgentObservability } from "@voltagent/core";
import { openai } from "@ai-sdk/openai";
import { createLangfuseSpanProcessor } from "@voltagent/langfuse-exporter";

// Define your agent
const agent = new Agent({
  name: "my-voltagent-app",
  instructions: "A helpful assistant that answers questions without using tools",
  model: openai("gpt-4o"),
});

// Configure Observability with Langfuse processor
const observability = new VoltAgentObservability({
  spanProcessors: [
    createLangfuseSpanProcessor({
      publicKey: process.env.LANGFUSE_PUBLIC_KEY,
      secretKey: process.env.LANGFUSE_SECRET_KEY,
      baseUrl: process.env.LANGFUSE_BASE_URL, // optional
      debug: true, // optional
    }),
  ],
  // Optional: disable VoltOps remote export to avoid duplicates
  voltOpsSync: { sampling: { strategy: "never" } },
});

// Start VoltAgent with custom observability
new VoltAgent({
  agents: { agent },
  observability,
});
Automatic Tracing
Everything in your VoltAgent is automatically traced:
- Agent conversations
- Tool executions
- Multi-agent delegations
- Error handling
- Performance metrics
Zero Configuration
You don't need to insert extra code. VoltAgent follows the OpenTelemetry standard, and Langfuse follows it as well. Plug-and-play!
How It All Works Together
This diagram shows the complete flow from user query to developer insights, demonstrating how every step gets automatically traced and evaluated.
Real Life Scenarios
Scenario 1: Performance Debugging
Problem: Users report "system is slow".
What You See in Langfuse:
- Dashboard shows average response time is 8 seconds (should be 2 seconds)
- In traces you see external API calls taking 6 seconds
- You know which API is the problem
Solution: Add caching and reduce response time by 75%.
Scenario 2: Quality Issues
Problem: Agent returns weird responses to some questions.
What You See in Langfuse:
- Evaluation dashboard shows low scores in certain categories
- You inspect faulty traces and find patterns
- You are aware of which prompts are faulty
Solution: Rewrite prompts and check with A/B testing.
Scenario 3: Cost Optimization
Problem: LLM costs monthly are 3x what they are supposed to be.
What You See in Langfuse:
- Cost dashboard shows which agents are expensive
- Token usage analysis finds overly long prompts
- You are aware of which conversations take too many tokens
Solution: Model downgrade and prompt optimization reduce cost by 60%.
Production Best Practices
Monitoring Strategy
When keeping an eye on your LLM application in production, take a layered approach. At the ground floor level, observe server health and database performance at the system level. The second level up, observe VoltAgent metrics and error rates at the app level. The third level up, observe Langfuse traces and quality scores at the AI level. At the topmost level, observe user satisfaction and conversion rates at the business level.
The multi-layered design enables you to see at a glance where problems are coming from. A server problem, app bug, AI quality defect, or business logic error - you can see each separately.
Alert Configuration
Divide alerts into three categories. Critical alerts are situations that demand immediate action - system down, percentage of errors exceeded 5%, response time exceeded 10 seconds. When these types of alerts come in, you have to act immediately.
Warning alerts are conditions worth watching out for. Quality score dropped more than 20%, cost increased by 50%, usage increased 200%. These are not critical conditions but could be problems if they continue as trends.
Info alerts are conditions it is pleasant to be informed about. New user sign-up, changes in feature utilization, performance tuning. These alerts usually reflect positive trends.
Data Retention
Clean your data into three buckets. Hot data is data of last 7 days, real-time dashboard, active debugging and real-time alerts. This data should be stored on the fastest available storage.
Warm data is data of last 3 months - for trend analysis, monthly reporting and historical comparison. This data can be stored in relatively slower but accessible storage.
Cold data is data stored long-term - for long-term research and analysis for compliance requirements. The data may be stored in the cheapest storage, access time may be longer.
This solution has both cost optimization as well as maintains the performance. You can access any data whenever you require but incur unnecessary storage costs.
Security and Privacy
Data Protection
Langfuse provides you with two methods of protecting your data. If you choose Langfuse Cloud, you have enterprise-grade security that is SOC 2 Type II compliant. GDPR compliant, it fully adheres to all European data protection laws. Your data remains in Europe with EU data residency and is protected by end-to-end encryption.
The self-hosted option works best for those who require full control. Your data is completely in your control, you can implement your own security policies. You can host it on your own servers with on-premises deployment, even use it in air-gapped environments.
Processing PII
Automated scrubbing for protection of personal data exists. Email addresses, phone numbers, credit card numbers and social security numbers are automatically identified and masked.
You can even implement domain-specific sensitive data custom filters. You can even have your own custom rules with configurable regex patterns, select what to protect with whitelist/blacklist approach. For example, you can automatically mask internal ID numbers, special codes or domain-specific data.
Team Collaboration
Role-Based Access
VoltAgent + Langfuse is not just a tool for developers, but it is a team tool. Different access levels and dashboards by role.
Developers have the widest access. They get to view all the traces with trace access, view errors with debug information, view bottlenecks with performance information, resolve issues with error information. They get to utilize everything needed to resolve technical issues.
Product Managers are more user experience focused. They consider how users interact with user experience metrics, learn what features are popular with feature usage statistics, check overall quality with quality dashboards, achieve success with business KPIs.
Data Scientists are analytics-focused with respect to access. They can examine raw data with raw data access, measure AI model success with model performance, review experiments with A/B test results, perform deep analysis with statistical analysis.
Support Team is user-focused. They can see customer history along with user conversation history, replicate issues using issue recreation, give feedback using quality feedback, manage crisis cases using escalation triggers.
Collaboration Features
Ease-of-work features are available as well. With shared dashboards, you can create team-specific views, bookmark important traces, comment on observations, share insights.
With the notification system, coordination of teams is ensured. You can share important notices to the team channel with Slack integrations, alert critical notices using email notifications, push to your own systems with customized webhooks, get alerted anywhere with mobile notifications.
Conclusion: Why VoltAgent + Langfuse?
Building LLM apps is tough. But with VoltAgent + Langfuse, at least you know what's going on.
With this combination, you have:
- Visibility: You have visibility on everything
- Control: You can control prompts from the center
- Quality: You can do systematic testing
- Optimization: You can optimize cost and performance
- Collaboration: You can collaborate as a team
Our advice: Start today. Create a basic agent, integrate Langfuse, master the dashboard. In one week you'll be exclaiming "how was I living without this?"
And don't forget - Running LLM in prod with no observability is like driving blindfolded. Consider yourself and your users.