
Introduction
Alright, so you're playing around with LLMs – maybe building something cool. But here's the thing: getting them to work reliably? That's the tricky part. Sometimes they give you exactly what you want, and other times the output makes no sense at all. When it goes wrong, how do you figure out why?
That's where LLM Observability comes into the play.
Yeah, "Observability." Sounds like another one of those tech terms, doesn't it? Maybe a bit overused. But look, if you want to build AI stuff that actually works, that doesn't break in weird ways, and that you can actually understand, then we gotta pay attention to this.
What's the Big Deal with LLM Observability Anyway?
Think about the software you usually build. When something goes sideways, you've got logs, metrics, traces – a whole set of tools to figure out what broke. You can see what's happening.
They can often feel like a total black box. You feed them a prompt, they do some incredible (and often mysterious) internal processing, and out pops an answer. But what actually happened in between?
LLM observability is all about getting those crucial insights.
- Why on earth your LLM said what it said.
- How well it's actually performing (or not performing).
- Where things might be going wrong.
- And yeah, how much all this magic is costing you.
Why You Absolutely Need LLM Observability
Okay, so it helps you see inside the LLM. Sounds good. But what does that really mean for you and your cool new AI project? Let's break it down into why this isn't just a nice-to-have, but a must-have:
- No More Hair-Pulling Over Bugs: Your LLM gives a weird answer, "Where did that come from?" Observability tools help you trace the problem, whether it's a bad prompt, an issue with the data it's using, or the model just having an off day.
- Build AI People Can Actually Trust: Let's face it, users want AI that feels dependable and makes sense. By keeping a close eye on your LLM's behavior, you can ensure the quality, safety, and fairness of what it puts out. That's how you build trust.
- Keep Your Wallet and Your Watch in Check: LLMs can use a lot of resources. Good observability lets you track critical things like token usage (which hits your budget directly) and how fast your model is spitting out answers (latency). Nobody's a fan of a slow or surprisingly pricey app.
- Catch Problems Early: Models aren't static; they can "drift" over time. This means their performance can degrade or change in unexpected ways. Solid observability helps you spot these shifts early, so you can tweak, retrain, or adjust before it becomes a major problem.
- Happier Users, Happier You: At the end of the day, understanding your LLM better leads to a better product and a smoother ride for your users. And happy users? That's the name of the game.
LLM Common Issue Spotter
Select an issue to see which observability areas can help:
The Core Pieces: What Should You Be Watching?
Alright, convinced? Ready to get this "observability" thing sorted? The next question is, what exactly should you be keeping an eye on? It can seem like a lot, but here are the main parts:
-
Prompt & Input Tracking: Know Your Starting Point
- What kind of prompts are people (or your system) actually sending? You'd be surprised!
- Are there patterns? What makes a prompt successful? What makes one fail badly?
- And importantly, is anyone trying to be sneaky and trick your LLM with "prompt injection"? You need to log them to understand them.
-
Output & Response Monitoring: What's It Actually Saying?
- Definitely log the text the LLM generates.
- But also, how good is it? Think about relevance, if it makes sense (coherence), and super importantly, if it's saying anything problematic – like toxic language or generating incorrect information (often called "hallucinations").
-
Following the Breadcrumbs (Especially for Agents/Chains): If your LLM isn't working alone – maybe it's part of an agent that uses tools or follows a chain of thought – you'll want to see those intermediate steps.
- Which tools did it decide to use? And why?
- What was its internal "reasoning" process (as much as we can see it)?
-
Performance Check-Up: The Vital Signs
- Latency: How long are users waiting for a response? Too long, and they're gone.
- Throughput: How many requests can your setup handle? Planning for scale is key.
- Token Counts: How many tokens are being used for inputs and outputs? This one's important for cost!
-
Counting the Beans: Cost Tracking Seriously, keep an eye on those API bills.
- How much is each request, or each user, or each feature really costing?
- Can you spot any features that are surprisingly expensive?
-
Listen to Your Users: The Feedback Loop Your users are an incredible source of truth. Make it easy for them to tell you what they think.
- Simple thumbs up/down on responses can be very valuable.
- What are they saying about the AI's helpfulness in general? Are they getting what they need?
-
Grading the Model: Is It Doing Its Job Well? Beyond individual responses, how well is the model actually doing its job over time?
- Track accuracy scores or other relevant metrics.
- Use specific evaluation datasets and benchmarks to see how it compares.
- And always, always be on the lookout for model "drift."
Phew! That does sound like a lot, doesn't it? But here's the good news: you don't have to do everything at once. Start with what feels most critical for your specific app and build from there.
The Not-So-Easy Parts: Why LLM Observability Can Be Tricky
Now, if getting full observability on LLMs was easy, everyone would have it all figured out already. The truth is, there are some unique problems that make it a bit more challenging than your average software:
- "Good" Can Be Super Subjective: What makes a "correct" or "high-quality" answer from an LLM? Sometimes it's obvious, but often it's pretty fuzzy and depends heavily on context. This makes setting up automated quality checks a real challenge.
- It's an Ocean of Information: LLMs process large amounts of text – tons and tons of it. Logging, storing, and then actually analyzing all that data can be a big job.
- The Need for Speed (Real-Time): If your LLM is interacting with users live, you often need to monitor what's happening in real-time. Catching issues as they happen is crucial.
- Still Developing: Honestly, standards for LLM observability are still developing. Different models and platforms do things their own way, so it's not always plug-and-play.
- Privacy is Paramount: Prompts and responses can easily contain sensitive, personal information. You've got to be incredibly careful and responsible about how you log, store, and protect this data.
Your Toolkit: How to Actually Do LLM Observability
Alright, enough about the challenges – let's talk solutions! What tools and techniques can you actually use to get a better handle on your LLMs?
- Good Ol' Logging, But Smarter: Don't throw out your existing logging practices! Adapt them. Standard logging frameworks are your first line of defense, but make sure you're capturing LLM-specific stuff like prompts, full responses, token counts, and maybe even those intermediate thoughts if you can get them.
- Tracing the Journey (Hello, OpenTelemetry!): For anything more complex than a single LLM call (think microservices, or chains of LLM calls), distributed tracing is your best friend. Tools like OpenTelemetry can help you see the entire lifecycle of a request as it bounces between different parts of your system.
- Vector Databases to the Rescue: These are becoming super handy. You can store embeddings of your prompts and responses, then search for similar ones. This is great for spotting common issues, finding anomalies, or even powering some clever automated quality checks.
- Dashboard Superstars (Prometheus, Grafana, Datadog, etc.): If you're already using platforms like these for your other apps, you can often hook them up to your LLM data too. They're awesome for visualizing metrics, creating dashboards, and setting up alerts when things go weird.
- So, How Do You Grade an LLM, Anyway? (Evaluation Techniques):
- Human Review is Often King: Sometimes, you just need a human to look at the output and say, "Yep, that's good," or "Nope, that's way off."
- Model-Based Eval (AI Judging AI): Using another LLM (or a simpler, more focused model) to score the output of your main LLM. It's not perfect, but it can help scale your checks.
- Run it Through Benchmarks: Test your LLM against standard datasets and benchmarks to see how it compares against others or its own past performance.
Case Study: VoltAgent's Visual Approach to Observability
Speaking of specialized platforms, it's insightful to see how observability can be a foundational principle. When we were building VoltAgent, we ran smack into the same "black box" problem many developers face with AI agents.
Our biggest frustration? It was just so darn hard to understand why our agents made certain decisions. What steps did they take? Which tools did they pick, and when? And when an error inevitably popped up, figuring out exactly what went wrong felt like detective work without enough clues. Standard logs helped a bit, but they just weren't cutting it as interactions got more complicated.
We got a lot of inspiration from the visual debugging power of tools like n8n. We thought, "Why can't we have something that clear for AI agents?" So, we decided to build observability right into the core experience. The key differentiator for VoltAgent became our VoltOps LLM Observability Platform. This console isn't just another dashboard; it lets you visualize the entire lifecycle of your agents-we're talking LLM interactions, tool usage, state changes, even their internal reasoning-all laid out on an n8n-style canvas.
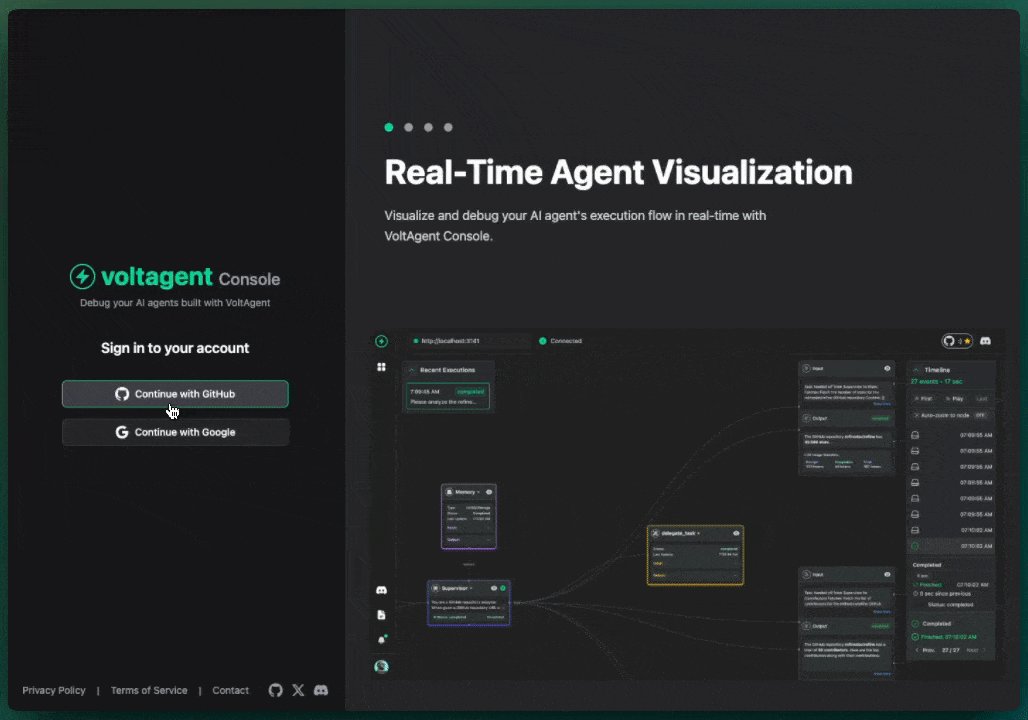
With this kind of visual approach, you can suddenly do things like:
- Clearly see the step-by-step execution flow your agent actually takes – no more guessing!
- Debug errors much, much more easily by pinpointing exactly where things went sideways on the canvas.
- Track your agent's performance and, crucially, LLM costs tied to specific steps in the flow.
- Easily compare results and execution paths when you're experimenting with different LLMs or tweaking your prompts.
Our whole goal with this visual, canvas-based observability is to make the agent "black box" transparent and understandable. If you're curious to see this approach in action, you can check out the VoltAgent documentation.
Getting Started: Best Practices for Sanity (and Success!)
Quick Check: What Should You Monitor First?
Answer these questions to get a starting point:
Ready to actually start implementing? Awesome. Here are a few tips to make your LLM observability journey a bit smoother and save you some difficulties down the road:
- Know Your "Why" (Seriously!): Don't just start logging everything because you can. That's a quick way to get overwhelmed. Ask yourself: What questions are you really trying to answer? What problems are you desperately trying to solve? Start with clear goals, and let those guide your efforts.
- Start Small, Then Grow Smart: You don't need to implement every single main part of observability on day one. Begin by logging the data points that are most critical for your app. You can always add more layers and sophistication later as you get a better feel for what you need.
- Figure Out What's "Normal" (Establish Those Baselines): You can't spot problems if you don't know what "good" or "normal" actually looks like for your specific LLM setup. Track your key metrics over time to get a feel for your baseline performance and cost.
- Build It In, Don't Just Add It Awkwardly Later: If you can, try to think about observability from the very start of your project. Weaving it into your development lifecycle early is a lot easier (and usually more effective) than trying to force it in after everything's already built.
- Humans + Machines = The Dream Team: Automated monitoring is fantastic, and you should use it. But don't forget the human element. Combine those automated checks with human oversight and evaluation, especially for the really nuanced stuff like output quality and fairness.
- Handle Data with Care (Especially the Sensitive Stuff): This one's huge. If you're logging prompts and responses (and you probably should be), make absolutely sure you're anonymizing, redacting, or otherwise protecting any personal or sensitive information. Seriously, don't mess this one up.
Wrapping It Up: Observability is Your LLM's Best Friend (Really!)
So, after all that, is LLM observability just another thing to pile onto your already massive to-do list? Well, yeah, it kind of is. But here's the important point: it's one of those things that can genuinely save you a ton of difficulties, a surprising amount of money, and a whole lot of user frustration down the line.
When you start to truly understand what your LLM is doing and why it's doing it, you shift from being a hopeful operator just crossing your fingers, to a confident architect of intelligent systems. You get the power to build AI applications that are more reliable, more efficient, and, importantly, more trustworthy.