
VoltOps: Tracking LLM Agents built with Vercel AI SDK in Production
Vercel AI SDK is today one of the most popular tools to create AI agents. That SDK is so popular among developers because of its TypeScript-first approach and inclusion of such cutting-edge AI features like streaming, tool usage, and multi-modal support right out of the box.
We wrote about this in our previous blog post.
You can plug dozens of providers from OpenAI to Anthropic, Google to Groq with a single unified API. This seriously speeds up development.
But check out the problem.
"I'm building awesome agents with Vercel AI SDK but I have no clue what's happening in production".
Sound familiar?
Building AI agents is easier with frameworks. But then comes the production nightmare: You don't know what tools your agent is executing, you can't see conversation flows, you can't monitor performance.
When we're building VoltAgent, I kept asking myself "What's my agent doing now?" Traditional monitoring tools? Not so effective for AI applications.
So we built the VoltOps LLM Observability Platform which provides comprehensive monitoring for AI applications built with frameworks like Vercel AI SDK.
Whether you're building chatbots, content generators, or complex multi-agent systems with Vercel AI, you need visibility into what's happening under the hood. Our platform tracks everything from individual LLM calls to complex agent workflows, giving you the insights you need to optimize performance and debug issues in production.
What Makes VoltOps LLM Observability Different
Unlike traditional monitoring tools that focus on model metrics, VoltOps LLM Observability is designed specifically for agent workflows. When you're building with Vercel AI SDK, you need more than just token counts and response times. Here's what makes it unique:
Agent-Centric Approach
VoltOps shows you what your agent is doing, not just how your model is performing:
-
Conversation flows - See the complete dialogue thread across multiple interactions. Track how users engage with your AI and where conversations succeed or fail. Unlike traditional tools that show isolated API calls, you get the full context of user journeys.
-
Tool usage patterns - Which tools are called when and why, with complete input/output tracking. See if your weather tool is being called appropriately, or if your database query tool is receiving the right parameters. This is crucial for debugging agent behavior in production.
-
Multi-agent interactions - How different agents collaborate and hand off tasks to each other. When you have a planning agent that delegates to execution agents, VoltOps tracks the entire workflow hierarchy, showing you parent-child relationships and data flow between agents.
-
Decision tracking - Why did the agent make that choice? See the reasoning chain that led to specific tool calls or responses. This helps you understand if your agent is making logical decisions or if there are gaps in your prompts or tool descriptions.
Live Visualization & Immediate Debugging
Real-time insights while your agent runs:
-
Watch execution flow as it happens - No waiting for batch processing or delayed dashboards. See your Vercel AI SDK agents execute in real-time, which is essential for debugging production issues as they occur.
-
Spot problems instantly - Instead of discovering failures hours later through logs, get immediate alerts when tools fail, when agents get stuck in loops, or when response times spike. This immediate feedback loop dramatically reduces time to resolution.
-
Zero latency monitoring - Between agent action and console visualization, there's virtually no delay. This real-time capability is particularly important for customer-facing applications where quick issue resolution directly impacts user experience.
What You Actually See
VoltOps visualizes the agent-specific data that matters for Vercel AI SDK applications:
🔀 Multi-agent coordination - Parent-child relationships and hierarchies visualized as interactive flowcharts. See how your main conversation agent delegates to specialized tools like code generators, data analysts, or customer service bots.
🛠️ Tool execution flows - Complete tool call sequences with inputs/outputs, execution times, and success rates. Know immediately if your database tool is receiving malformed queries or if your API integration is timing out.
💬 Conversation threading - How messages connect across interactions, showing user intent progression and agent response patterns. This helps identify where users get confused or where your agent provides incomplete responses.
🧠 Agent decision making - The reasoning behind each step, including which tools were considered but not used, and why certain responses were generated. This level of insight is impossible with traditional APM tools.
This is fundamentally different from traditional LLM monitoring that focuses on token counts, response times, and model accuracy. VoltOps shows you the behavior of your intelligent system, which is what actually matters when you're building production AI applications with Vercel AI SDK.
1-Minute Setup: No Kidding
Now let me demonstrate how to set this up for Vercel AI SDK.
Installation
npm install @voltagent/vercel-ai-exporter @opentelemetry/sdk-node @opentelemetry/auto-instrumentations-node
Just 3 packages. That's all.
API Keys
Go to console.voltagent.dev, create an organization, create a project, get your keys:
VOLTAGENT_PUBLIC_KEYVOLTAGENT_SECRET_KEY
Keep your secret key safe! Never commit it to your repository. Always use environment variables in production.
OpenTelemetry Setup
In your main file, do this:
import { VoltAgentExporter } from "@voltagent/vercel-ai-exporter";
import { NodeSDK } from "@opentelemetry/sdk-node";
import { getNodeAutoInstrumentations } from "@opentelemetry/auto-instrumentations-node";

// Create VoltAgent exporter
const voltAgentExporter = new VoltAgentExporter({
  publicKey: process.env.VOLTAGENT_PUBLIC_KEY,
  secretKey: process.env.VOLTAGENT_SECRET_KEY,
  baseUrl: "https://api.voltagent.dev", // default
  debug: true, // set to true for development
});

// Initialize OpenTelemetry SDK
const sdk = new NodeSDK({
  traceExporter: voltAgentExporter,
  instrumentations: [getNodeAutoInstrumentations()],
});

sdk.start();
Complete working example: https://github.com/VoltAgent/vercel-ai-sdk-observability Track AI calls, tool usage, and multi-agent workflows with minimal code changes.
Basic Telemetry
Insert a single line in your current Vercel AI code:
import { generateText } from "ai";
import { openai } from "@ai-sdk/openai";

const result = await generateText({
  model: openai("gpt-4o-mini"),
  prompt: "Hello, how are you?",
  experimental_telemetry: {
    isEnabled: true, // ← That's it!
  },
});
And done! 🎉
You may look at your agent in the VoltOps LLM Observability dashboard. It will be displayed by default as "ai-assistant" but no problems. For the moment, your calls to AI are being tracked, you can look at the execution flow.
You'll have a message like this in the console:
📋 VoltAgent: Using default agent for tracking.
💡 For improved tracking, add agentId to your metadata
This message is completely normal! VoltAgent automatically uses a default agent when no agentId is provided. This is actually helpful for getting started quickly. You can always customize it later.
Don't worry about this, this is normal. Let's move on to the next step for improved tracking.
Name Your Agent & Tool Usage
import { generateText } from "ai";
import { openai } from "@ai-sdk/openai";
import { z } from "zod";

const result = await generateText({
  model: openai("gpt-4o-mini"),
  prompt: "What's the weather in Tokyo?",
  tools: {
    weather: {
      description: "Get the weather in a place",
      parameters: z.object({
        location: z.string().describe("The place to get the weather for"),
      }),
      execute: async ({ location }) => {
        await new Promise((resolve) => setTimeout(resolve, 1000));
        return {
          location,
          temperature: 72 + Math.floor(Math.random() * 21) - 10,
        };
      },
    },
  },
  experimental_telemetry: {
    isEnabled: true,
    metadata: {
      agentId: "weather-assistant", // ← Now it has a name!
      instructions: "You are a helpful weather assistant",
    },
  },
});
What's the difference?
- You see "weather-assistant" in the VoltOps dashboard rather than "ai-assistant"
- You see tool usage - which tool was applied when, inputs/outputs
- You can view instructions as documentation
Seriously, this is very useful already.
Production-Ready Tracking
In production, you have users and conversations. You'd like to track those as well:
const result = await generateText({
  model: openai("gpt-4o-mini"),
  prompt: "What's the weather like in Berlin?",
  tools: {
    weather: {
      // identical weather tool
    },
  },
  experimental_telemetry: {
    isEnabled: true,
    metadata: {
      agentId: "weather-assistant",
      instructions: "You are a helpful weather assistant",
      userId: "demo-user", // ← User tracking
      conversationId: "weather-chat", // ← Conversation grouping
      tags: ["weather", "demo", "production"], // ← Categorization
    },
  },
});
At this point you have enterprise-level monitoring:
- User behavior analysis
- Conversation flow tracking
- Tag-based filtering and analytics
- Critical data for support
Multi-Agent Coordination
Most advanced section. When multiple agents collaborate:
// Main agent: Planning
const { text: plan } = await generateText({
  model: openai("gpt-4o-mini"),
  prompt: "Write a plan for team meeting",
  experimental_telemetry: {
    isEnabled: true,
    metadata: {
      agentId: "planning-agent",
      userId: "team-lead",
      conversationId: "meeting-organization",
      instructions: "You develop meeting plans and agendas",
      tags: ["planning", "meetings"],
    },
  },
});

// Child agent: Execution
const { text: execution } = await generateText({
  model: openai("gpt-4o-mini"),
  prompt: `Execute this plan: ${plan}`,
  experimental_telemetry: {
    isEnabled: true,
    metadata: {
      agentId: "execution-agent",
      parentAgentId: "planning-agent", // ← Parent relationship!
      userId: "team-lead",
      conversationId: "meeting-organization",
      instructions: "You handle meeting logistics and execution",
      tags: ["execution", "logistics"],
    },
  },
});
What does this give you?
- You can see agent hierarchies
- Parent-child relationships
- Complex workflow tracking
- Cross-agent context
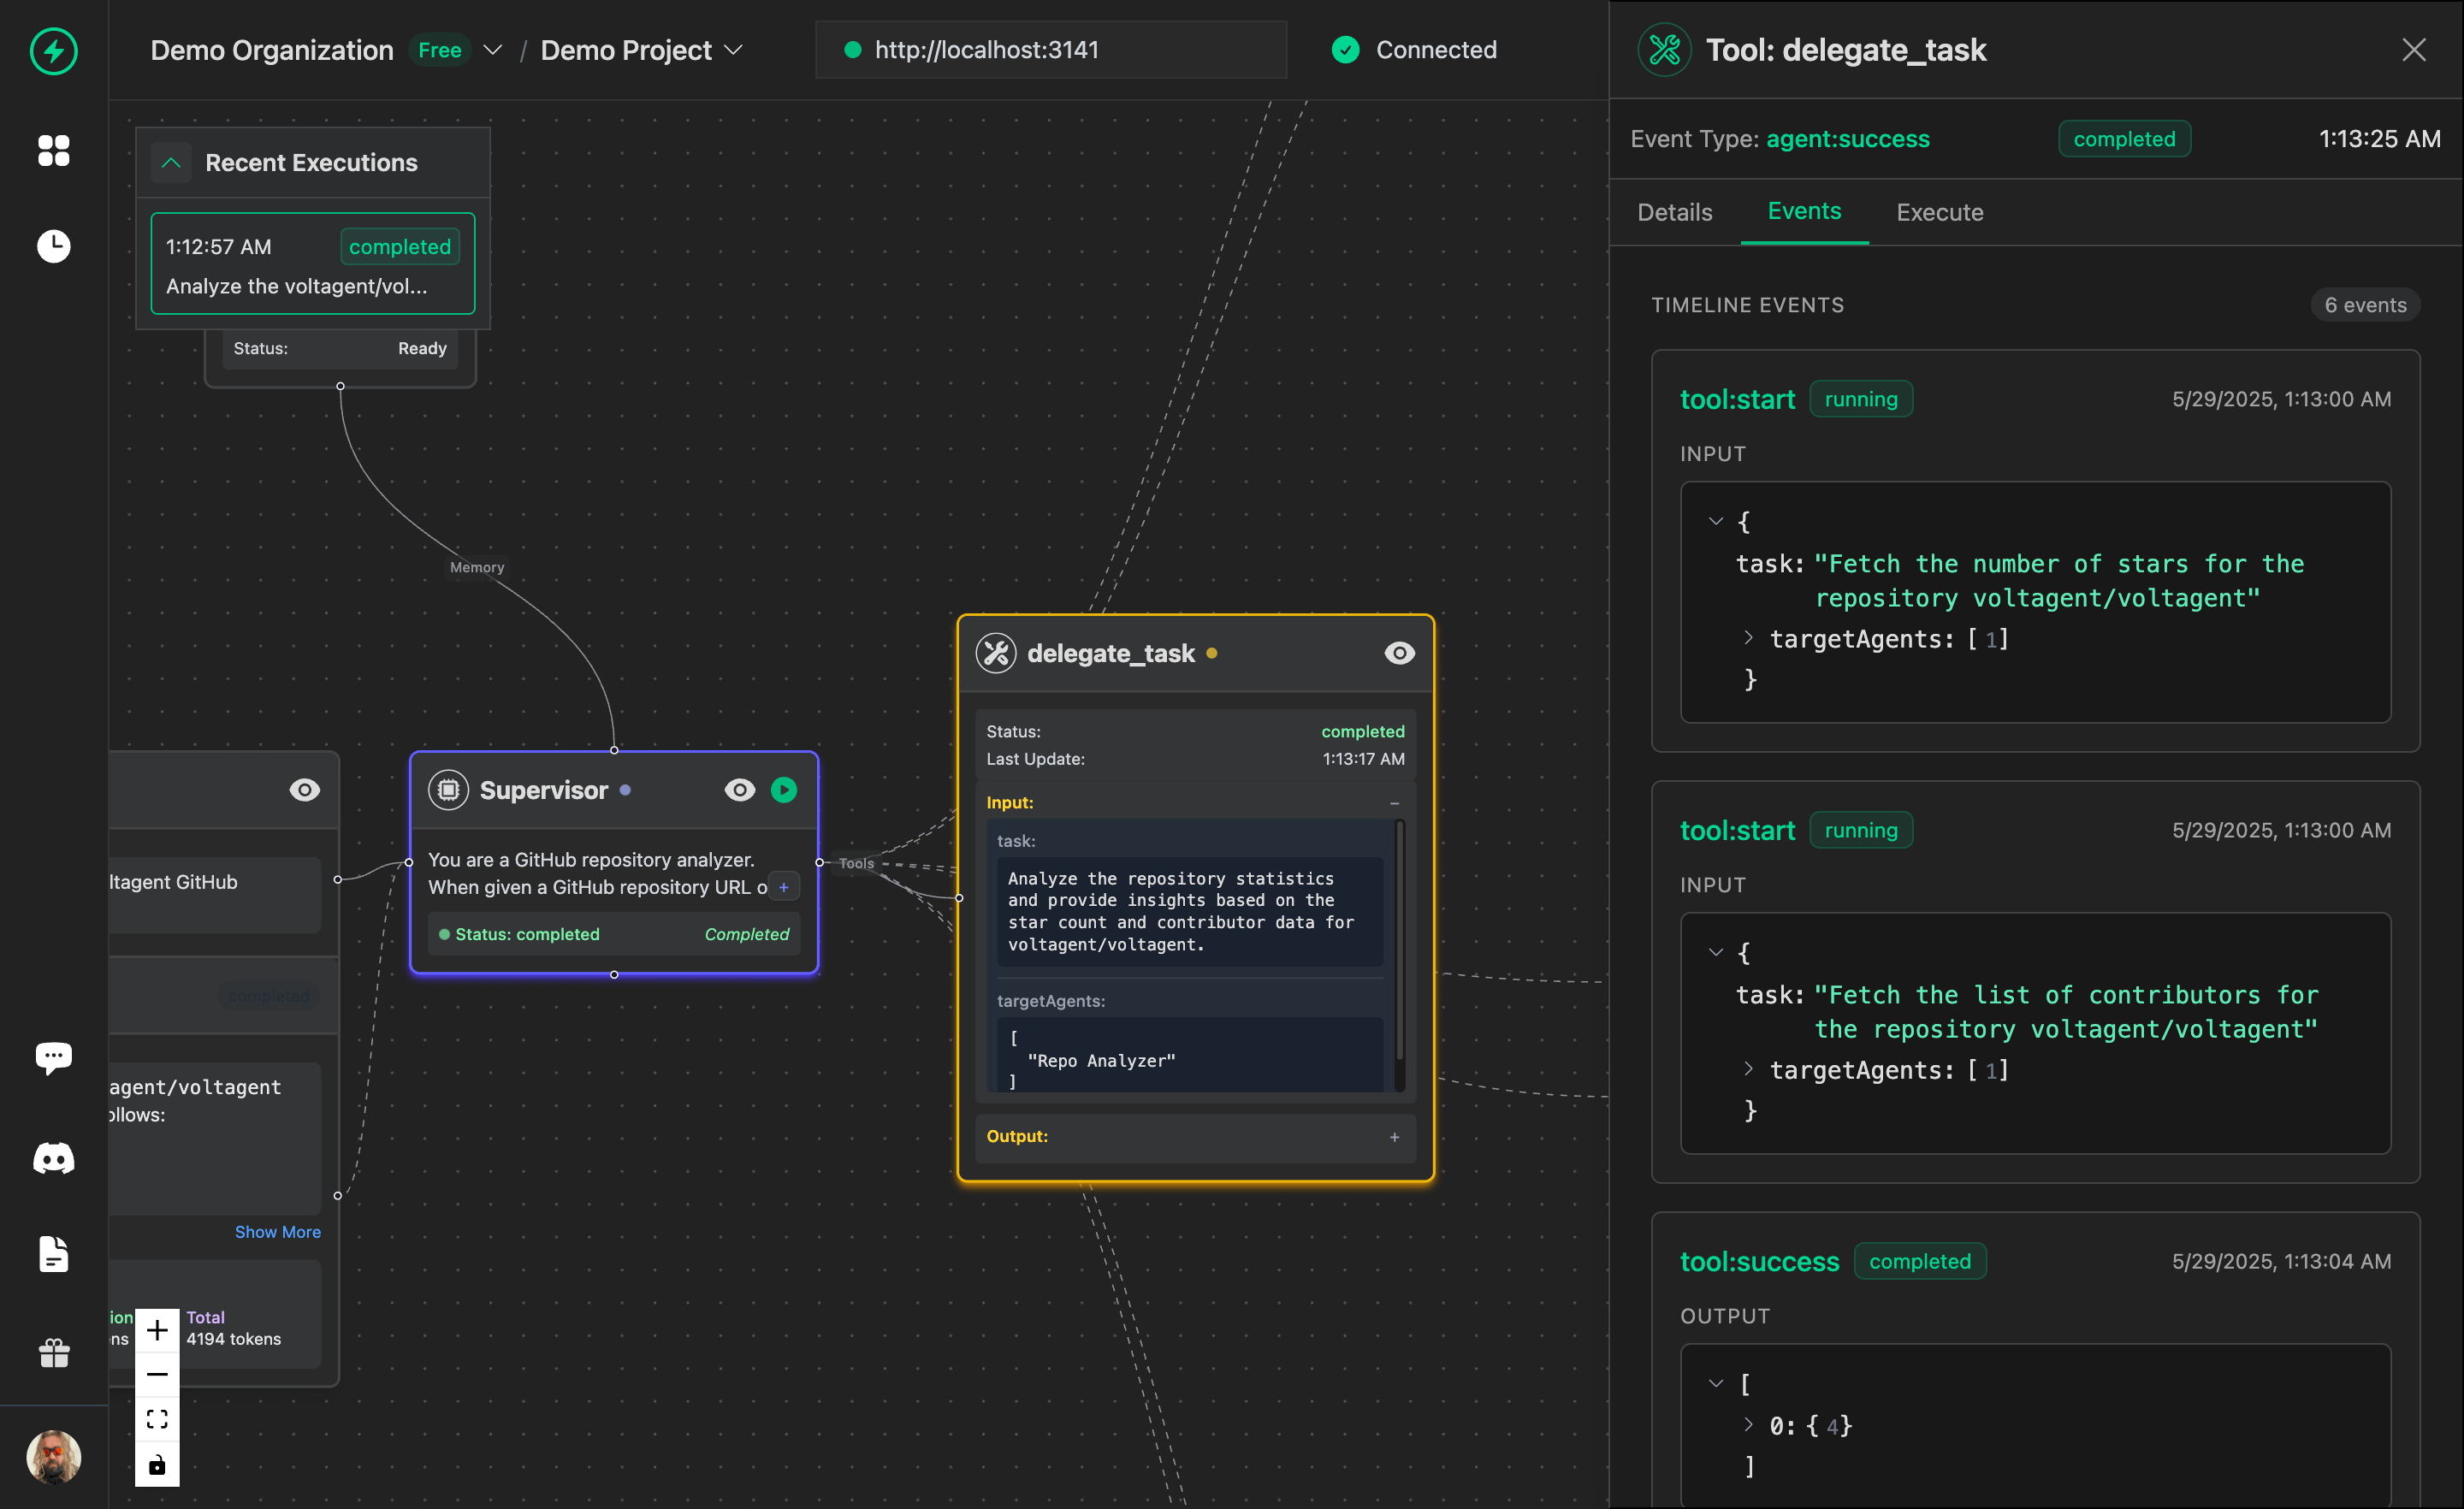
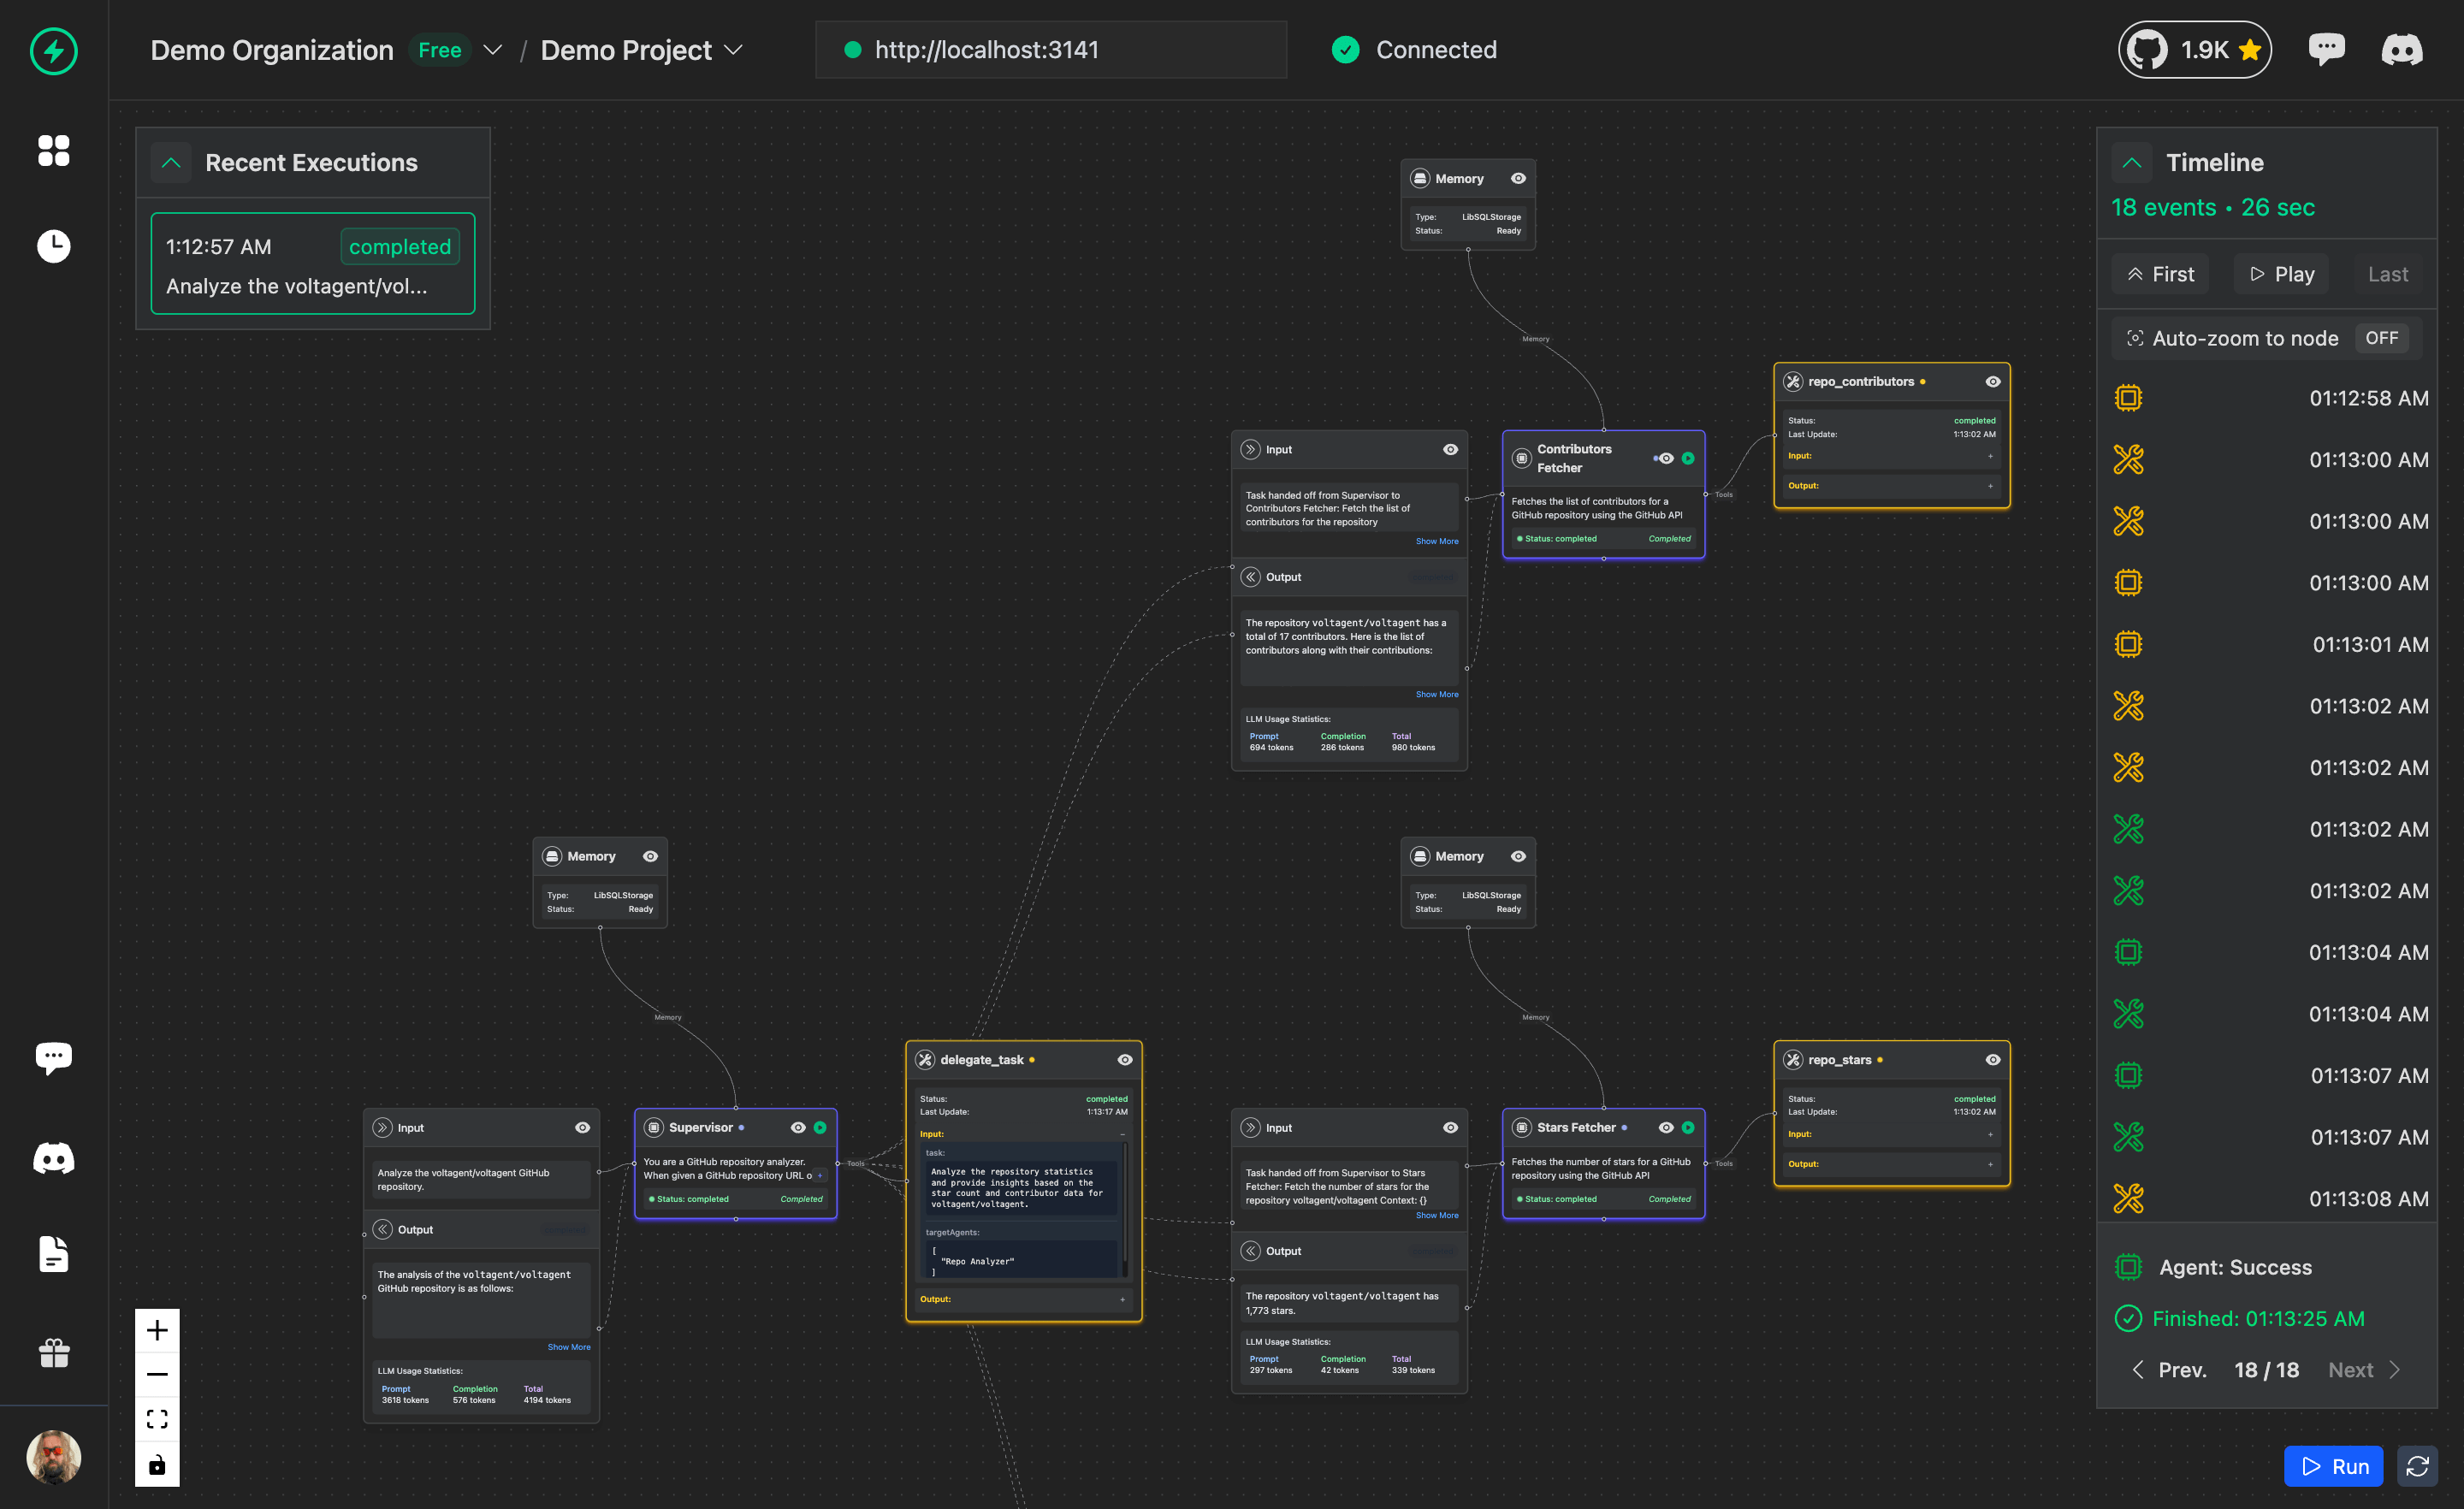
In the VoltOps dashboard you have a whole diagram of how agents are talking to each other.
What Do You See in the VoltOps Dashboard?
Now my favorite part. When you launch the VoltOps LLM Observability platform:
- Real-time agent activity dashboard - You can view what the agents are doing currently, in real time
- Conversation flows - Timeline of all conversations, tool usage
- Performance analytics - Response times, token usage, cost tracking
- Error debugging - Where it stopped, which tool was failing
- User analytics - Who uses it how often
There was a bug over the weekend in production. Usually I would spend hours debugging. Caught it in the VoltOps dashboard in 2 minutes - there was a timeout on a specific tool call. Life saver indeed.
How It All Works Together
Here's what happens behind the scenes when you add VoltOps observability to your Vercel AI calls:
This flow happens automatically once you add the experimental_telemetry flag. No additional code changes needed!
Final Words
AI development is moving very fast. But we are still at the stone age of monitoring.
The traditional APM tools are not enough for AI-specific needs. AI systems have their own share of challenges - tool calls, agent interactions, conversation flow, multi-modal data.
VoltAgent monitoring tries to fill this gap. And because it's framework-agnostic, you can use it on your existing code with minimal alterations.
Test it and give feedback. We always discuss new features in our community (Discord).
Seeing what your AI agents do is no longer a dream. Go and see what your agents are really doing! ⚡