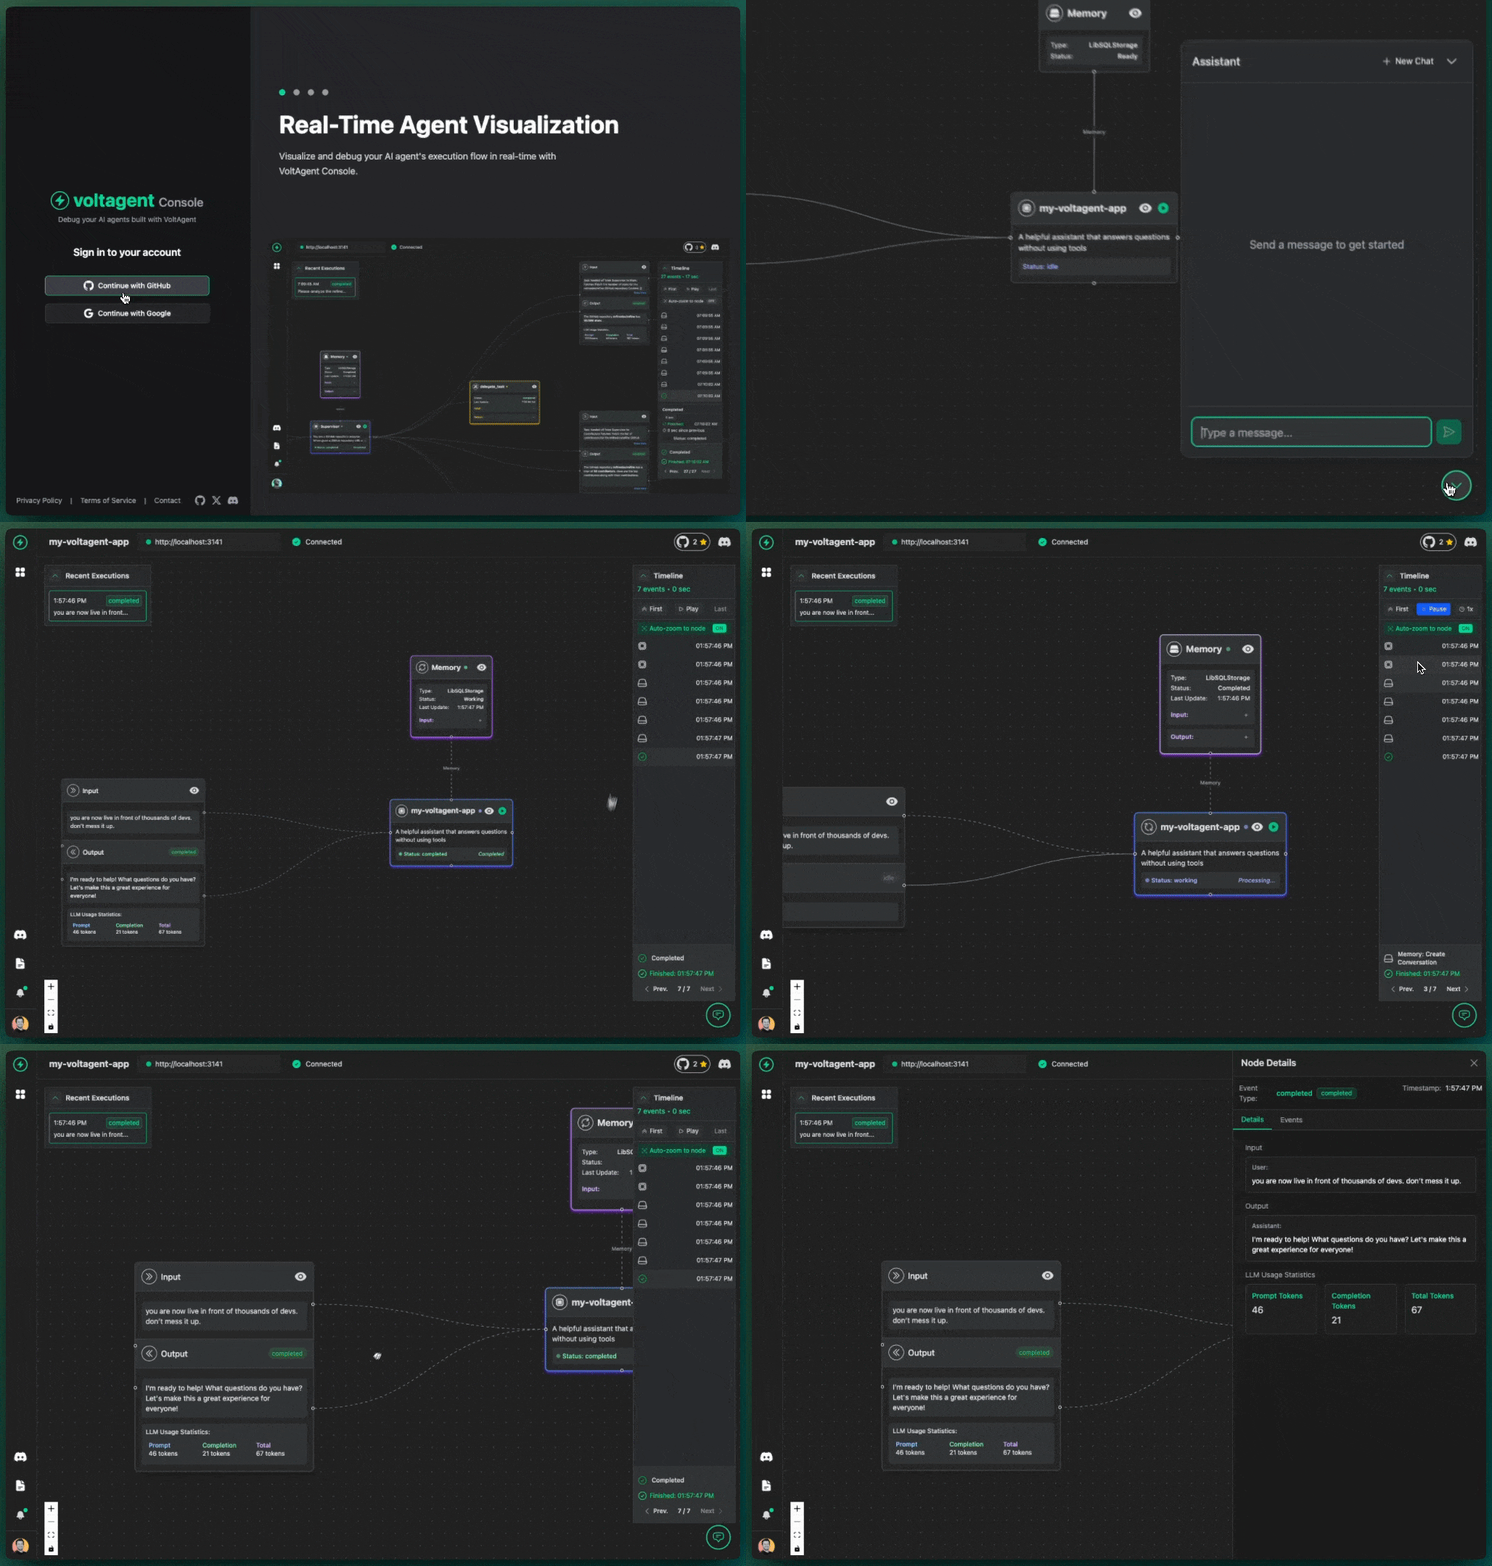
Building AI agents often feels like working inside a black box. Developers find themselves buried under endless console.log statements and scattered breakpoints, trying to piece together how an agent arrived at a decision. This guesswork gets exponentially harder with multi-agent systems. Adding a new agent, or even tweaking a prompt or tool in an existing one, creates a ripple effect. How do you ensure the whole system still works as intended? How do you verify the output is still correct?
This debugging cycle is slow, frustrating, and drains productivity. Developers lose focus chasing down elusive bugs instead of building innovative features. Ensuring the reliability and correctness of complex AI flows becomes a monumental, often uncertain, task.
VoltOps Platform: Clarity, Not Chaos
VoltAgent was designed observability-first precisely to solve this challenge. We believe developers need clear, intuitive tools to understand and manage AI complexity. The VoltAgent VoltOps Platform transforms AI debugging from a maze into a map.
Think of it as your visual command center for AI development:
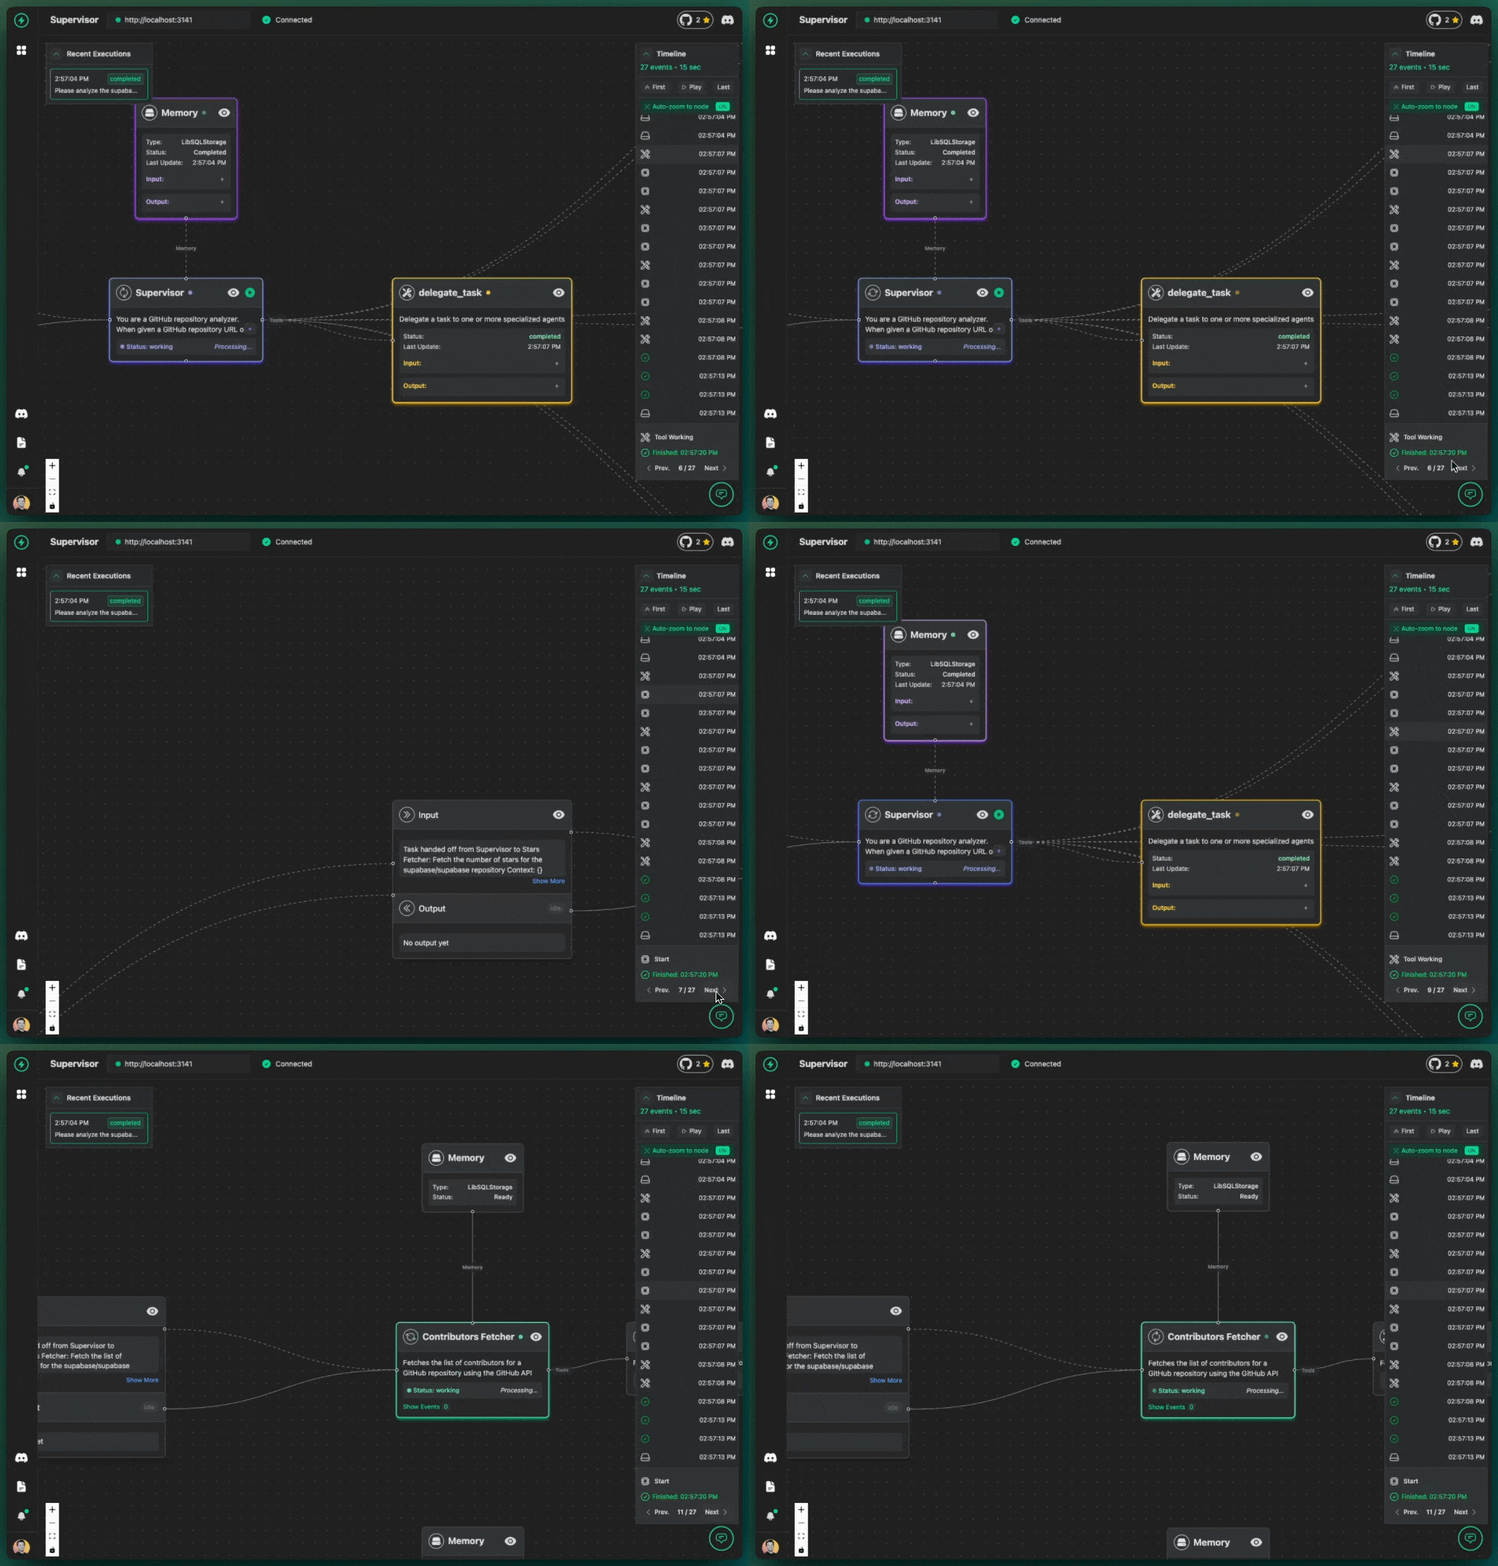
- See the Entire Flow: Inspired by the clarity of no-code tools, the Console visualizes your entire agent structure (built with the VoltAgent framework) on an infinite canvas. Watch in real-time as your agent executes, seeing exactly which functions run, which tools are called (including details like memory/chat context, RAG retrievals, and MCP server interactions), and the decision path taken.
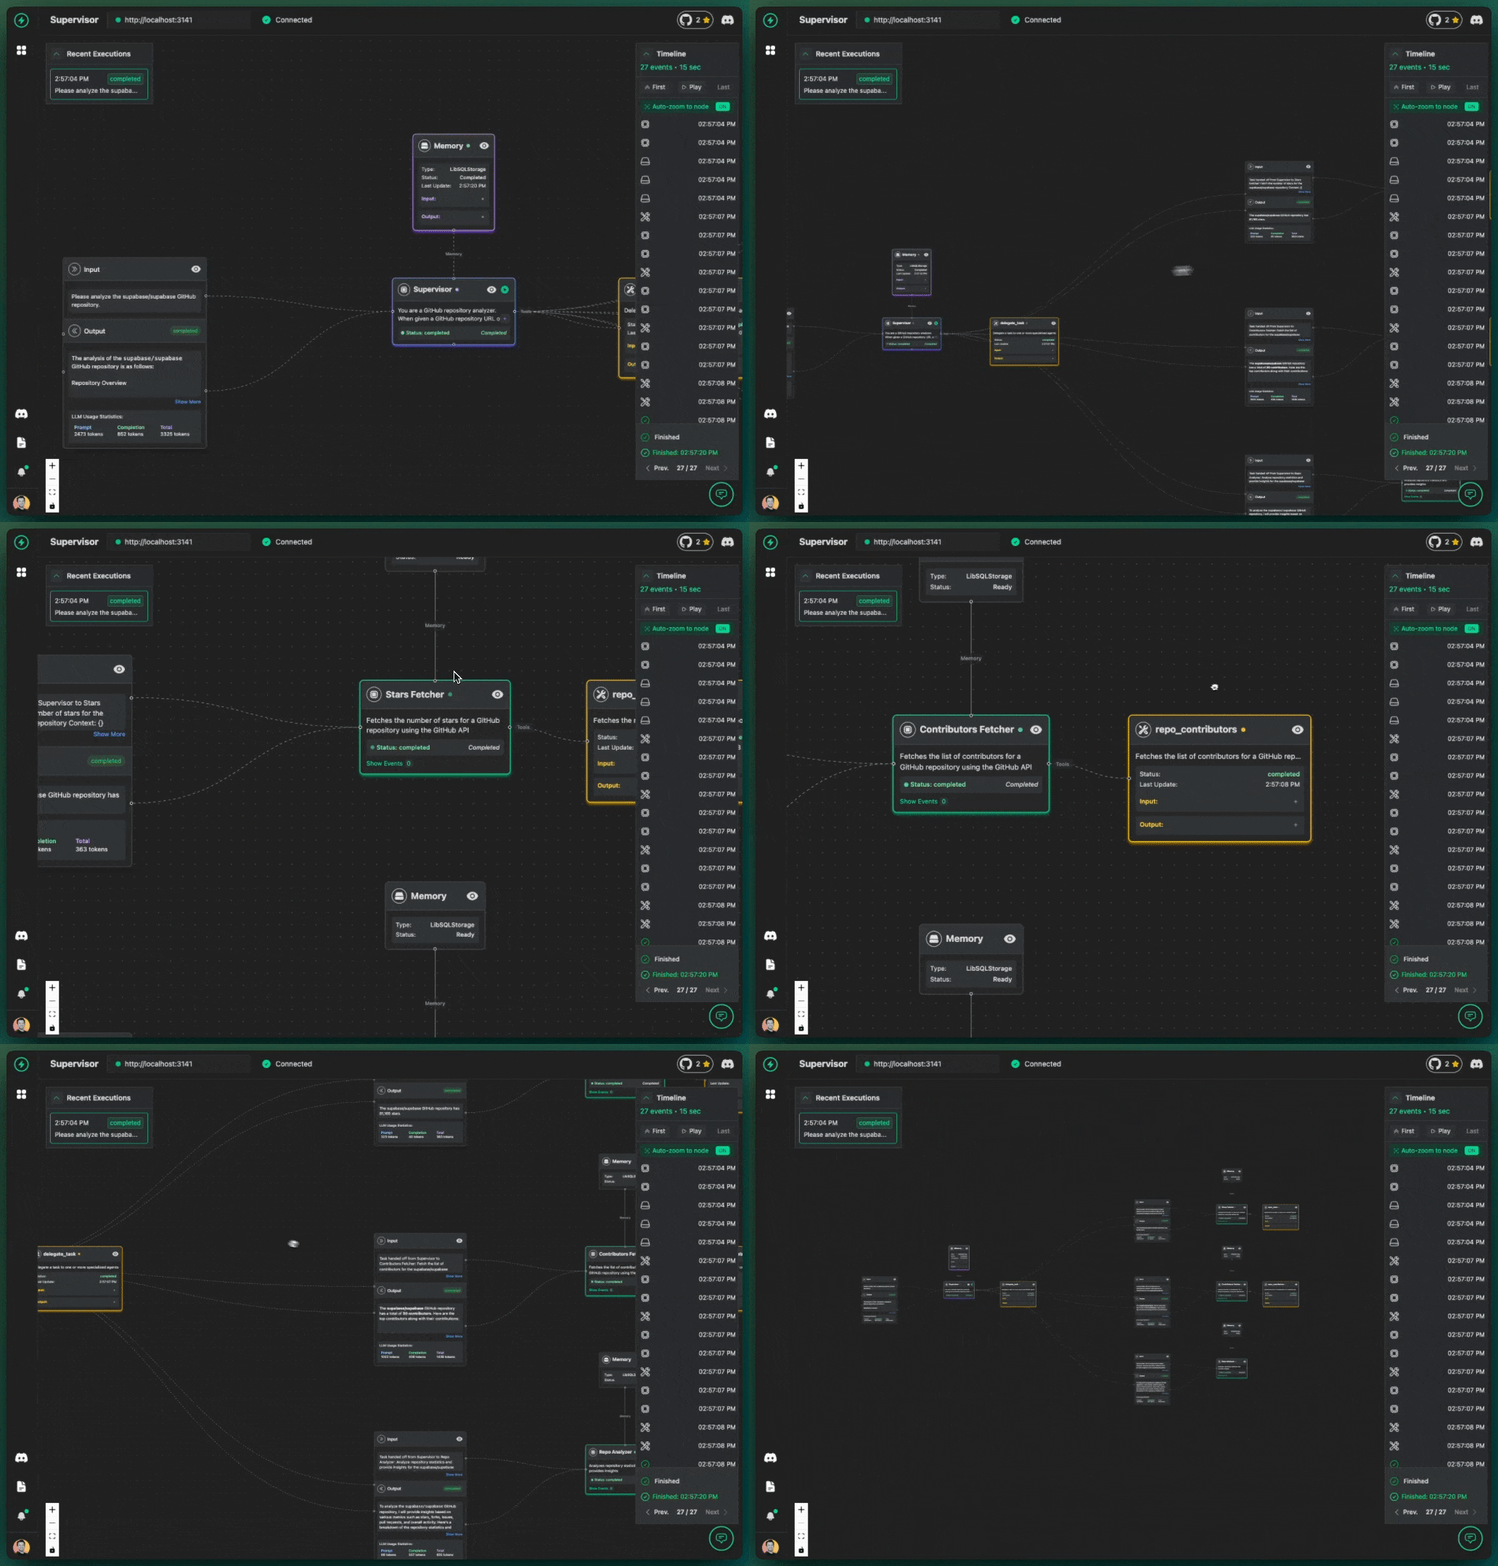
- Step-by-Step Timeline: Go beyond a static graph. Our timeline view lets you trace every step of an agent's journey from input to output. Understand precisely what data the agent processed and why it made specific choices at each stage.
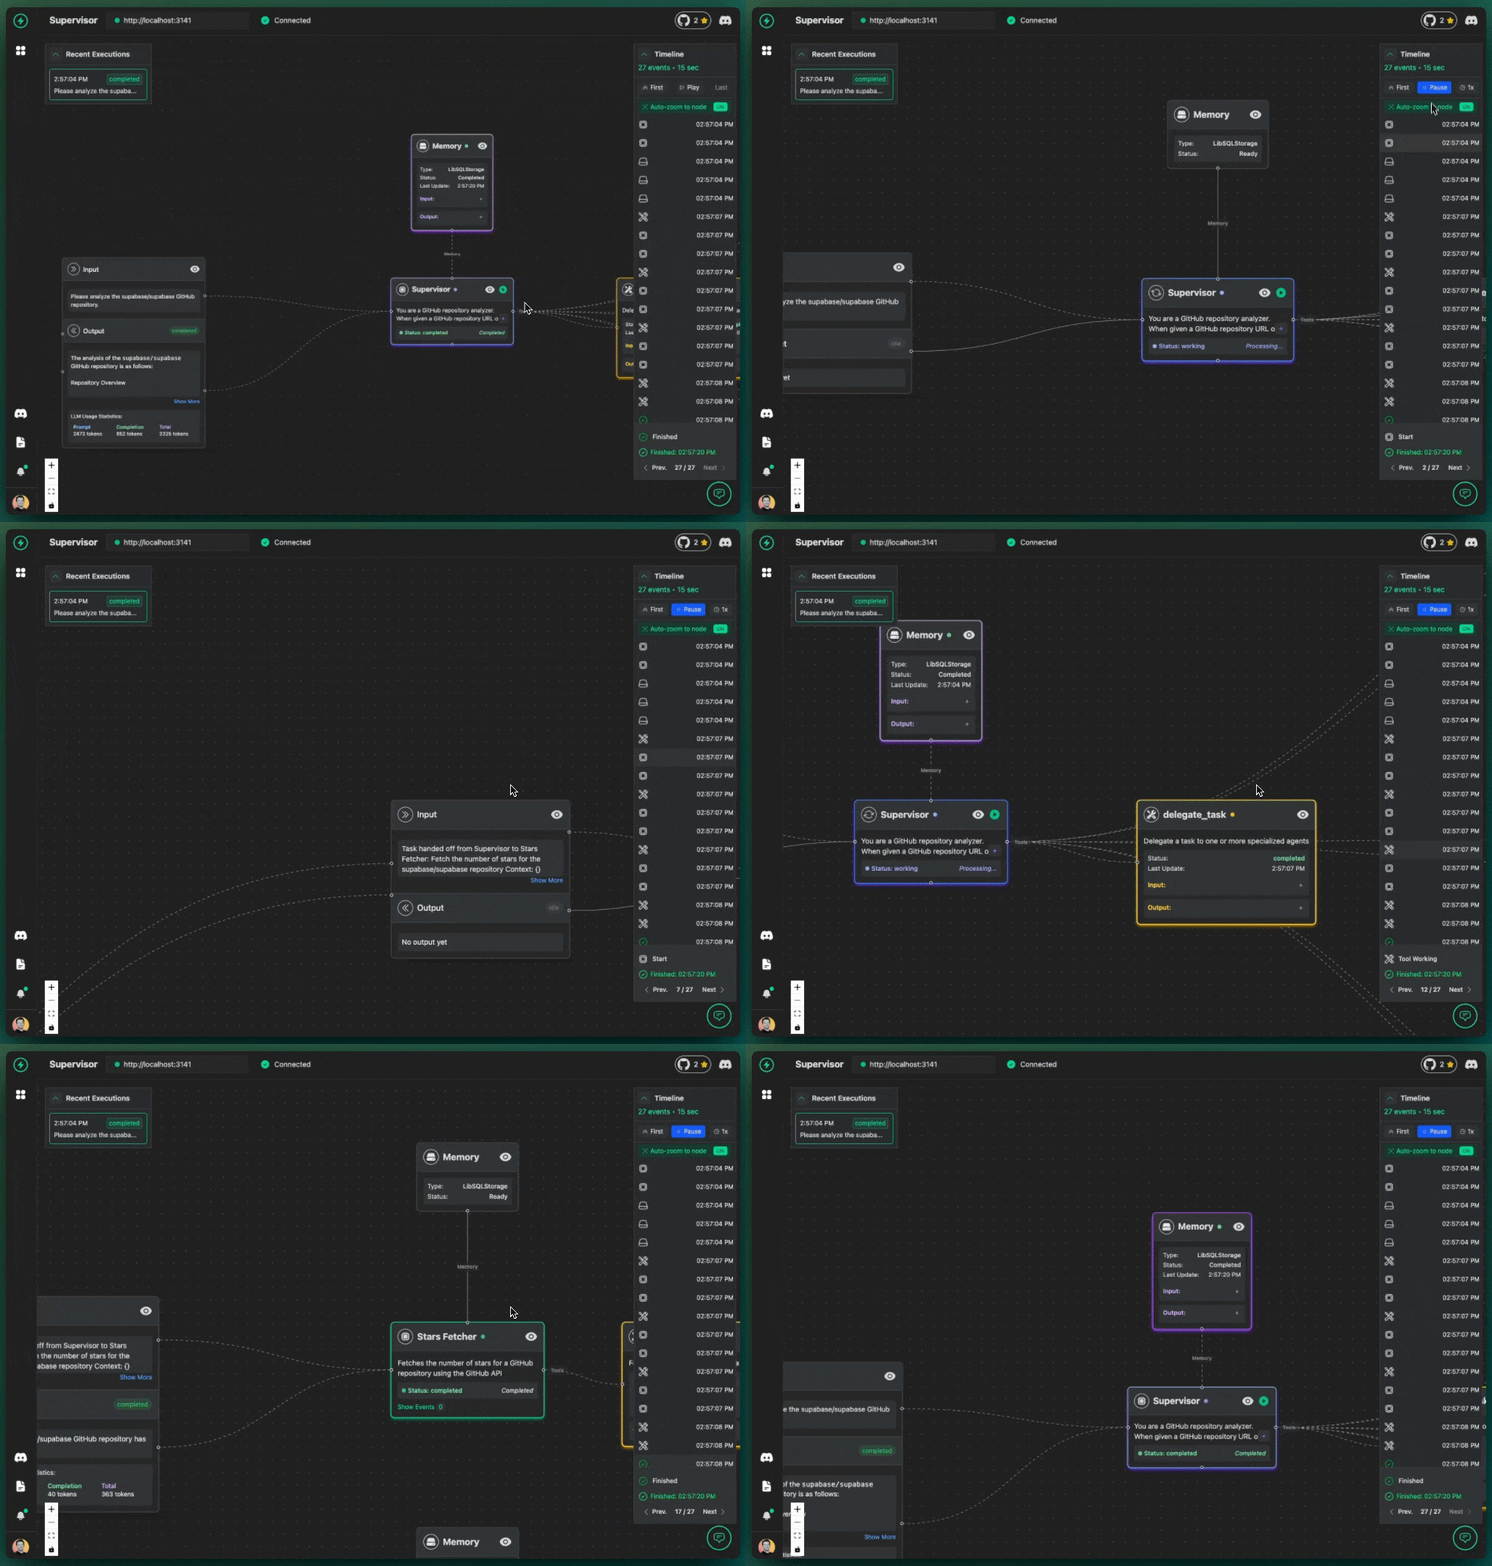
- Real-Time State Inspection: Dive into the agent's internal state, inputs, and outputs as they happen. No more guessing what variables hold or what a tool returned.
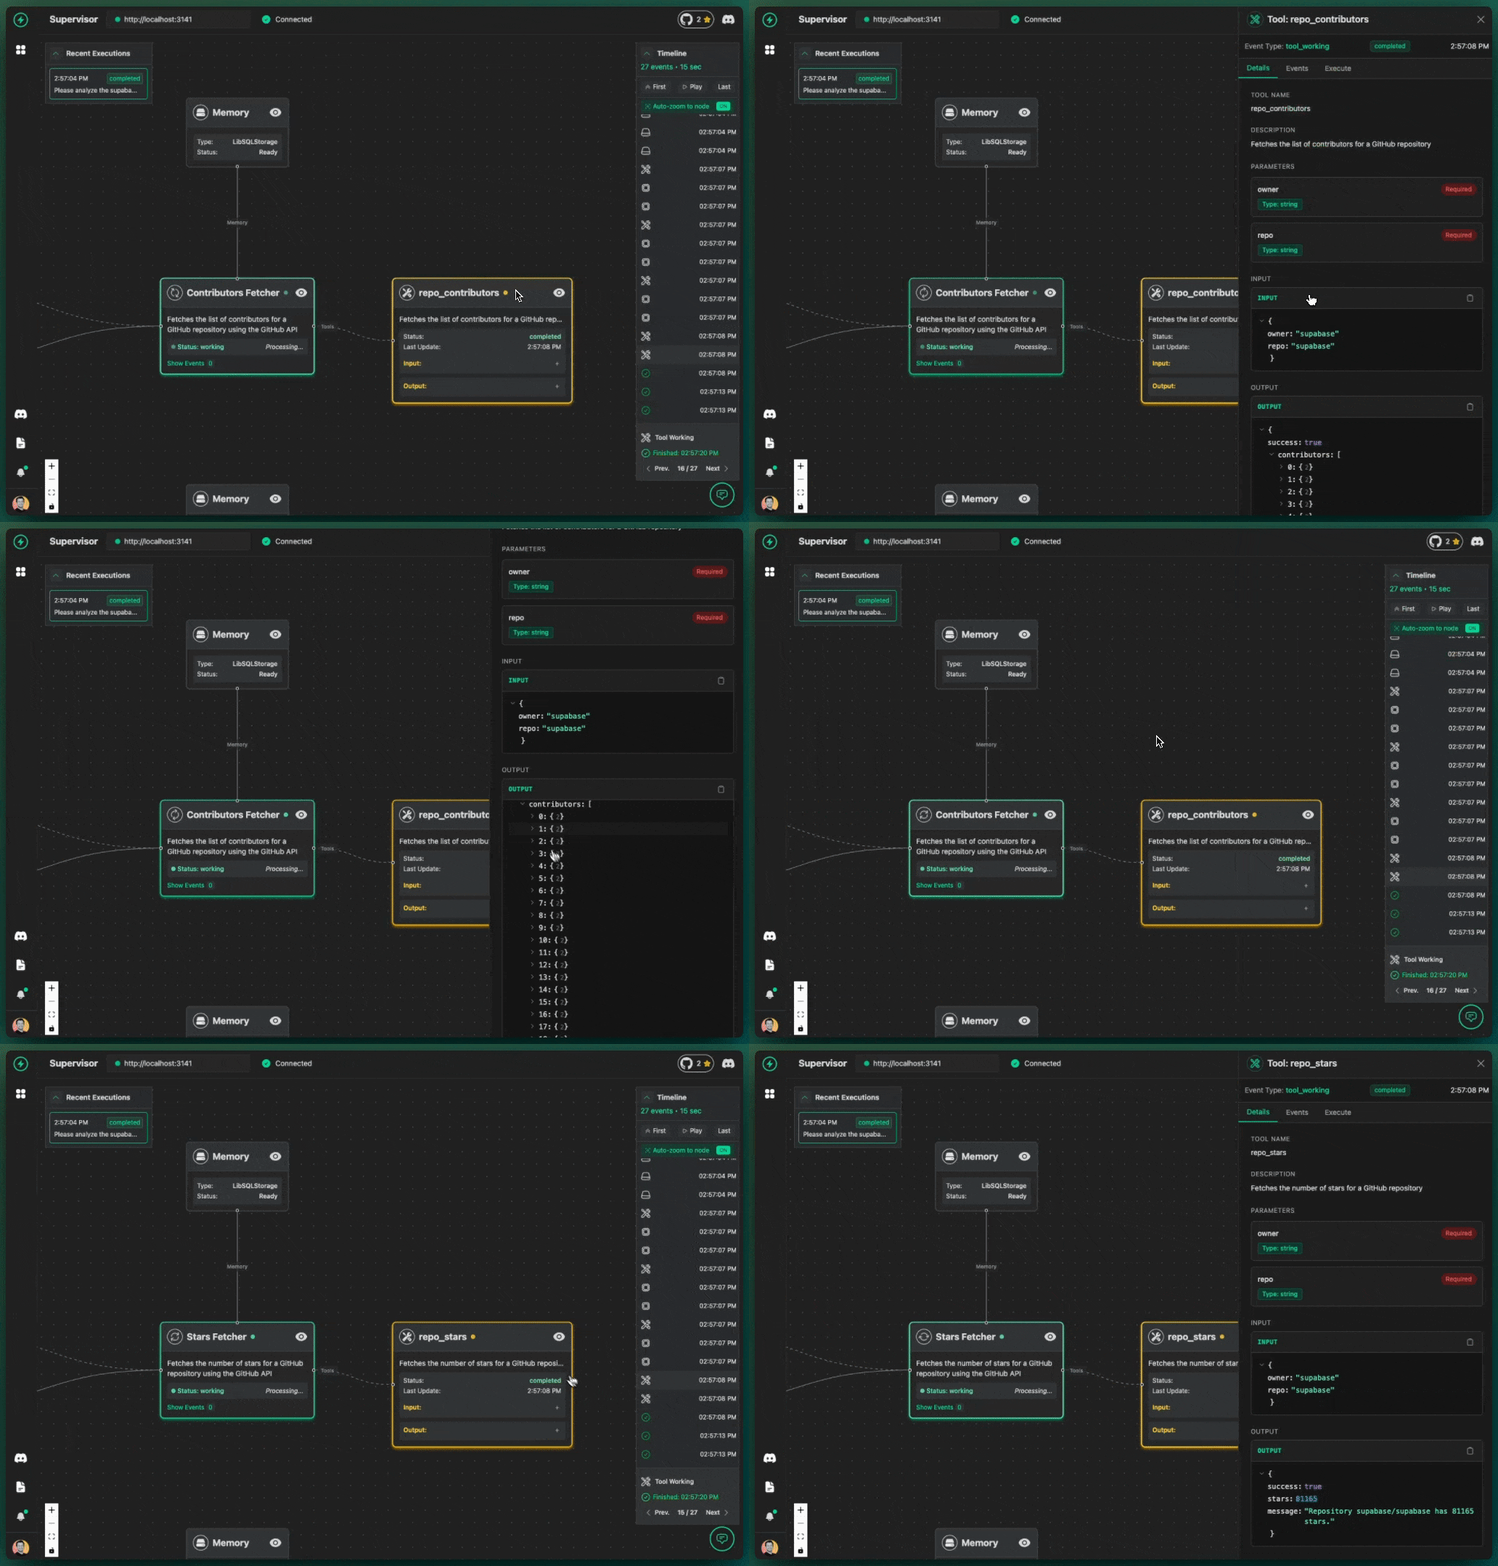
- Effortless Multi-Agent Debugging: The visualization inherently handles multi-agent complexity. See how agents interact, pass information, and contribute to the final outcome, all in one unified view.
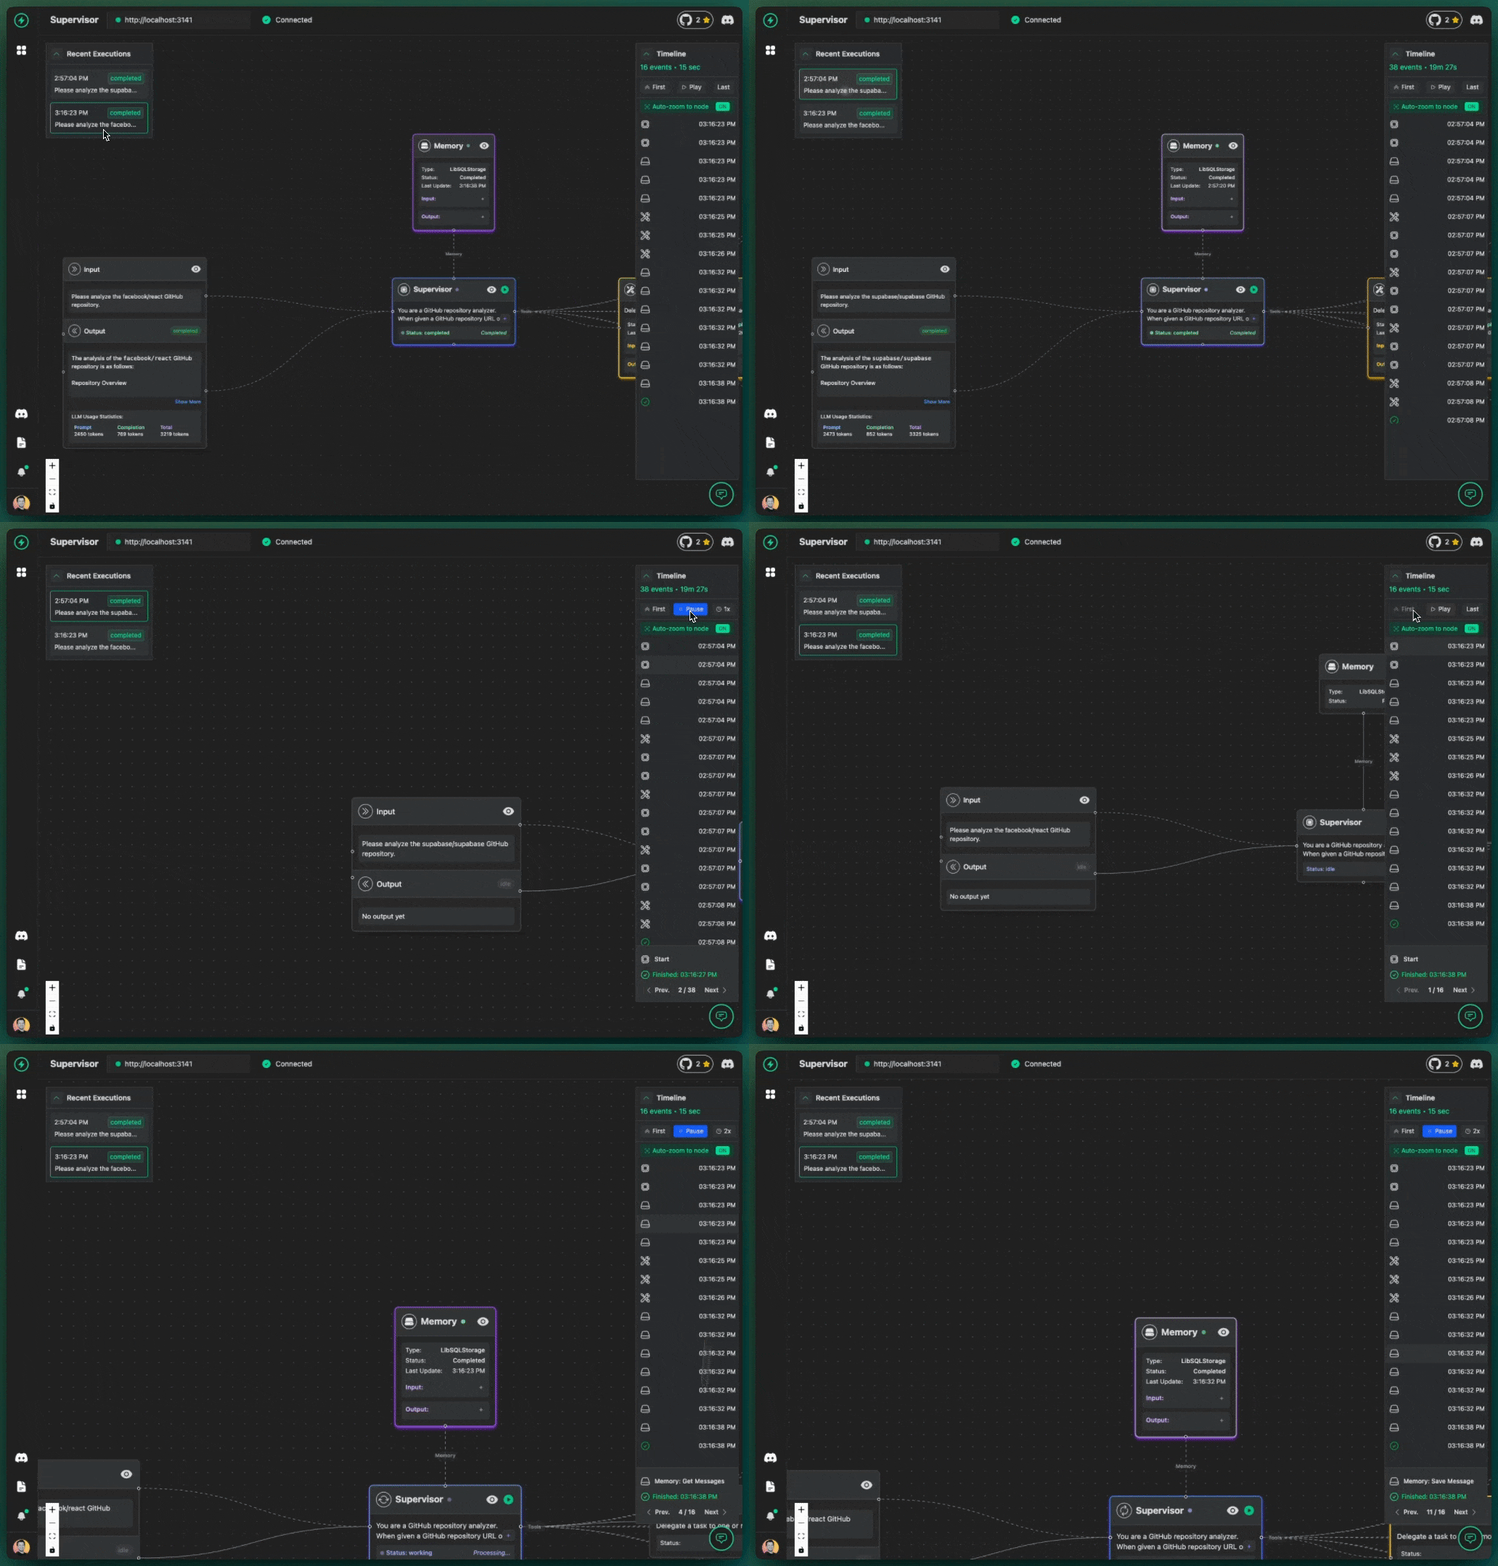
- Replay and Analyze: Easily revisit past agent runs (sessions). Debug intermittent issues or analyze specific scenarios by replaying the exact execution flow and state changes.
- Local and Secure: The Console connects directly to your local VoltAgent process. No sensitive agent data ever leaves your machine. Debug with complete peace of mind.
Stop Debugging, Start Building
The impact is immediate:
- Slash Debugging Time: Developers report drastically reduced debugging time – often cutting hours of guesswork down to minutes of clear analysis. Get back to building features, faster.
- Verify Changes Instantly: Easily observe the impact of prompt changes, new tools, or added agents. Visually confirm that your updates behave as expected.
- Deploy with Confidence: Understand your AI flows deeply. Ship to production knowing your agents are working correctly and reliably.
Production Observability
The benefits don't stop at development. The same observability that speeds up debugging provides crucial insights into production systems. When issues arise post-deployment, the Console's tracing and replay capabilities allow you to pinpoint the root cause quickly, leading to more robust and trustworthy AI applications.
The VoltOps Platform isn't just an add-on; it's fundamental to how VoltAgent empowers you to build sophisticated AI applications with clarity, confidence, and speed.
Why VoltAgent?
As outlined in our Manifesto, VoltAgent was born from our own experiences. We wanted the flexibility of code combined with the insightful visualization often found in visual tools, but without the lock-in. We believe the JavaScript ecosystem deserves dedicated, powerful AI tooling.
VoltAgent is our answer – a tool built by JS developers, for JS developers, aiming to make AI development less daunting and more productive.
What is VoltAgent?
Drawing inspiration from the clarity of No-Code tools but retaining the power and flexibility developers demand, VoltAgent provides:
- A Core Framework (
@voltagent/core): Robust foundations for defining agent logic, managing state, and orchestrating complex workflows. - Exceptional Observability: Forget
console.logdebugging. VoltAgent offers built-in tools (check our Observability docs!) to visualize agent execution, inspect state changes, and trace requests, drastically reducing debugging time from hours to minutes. - Seamless Integration (
@voltagent/vercel-ai, etc.): Easily connect with popular AI providers and platforms (explore the providers docs). - Command-Line Interface (
@voltagent/cli): Get up and running quickly with project scaffolding and management tools viacreate-voltagent-app. - Extensibility: Designed with modularity in mind, allowing for custom tools, providers, and integrations (like potential voice capabilities hinted at in
@voltagent/voice). - Clear Best Practices: We provide guidance and structure (see
agentsandutilsdocs) to help you build maintainable and scalable AI applications.
Get Started in Minutes
Ready to ditch the black box? You can start building your first agent right now:
npm create voltagent-app@latest my-first-agent
cd my-first-agent
npm run dev # or yarn dev / pnpm dev
Dive into our Getting Started Guide for a deeper look, and open the VoltOps Platform to see your agent in action!
Join the Community
VoltAgent is just beginning, and we're building it in the open. We believe in the power of community (check the community docs folder for ways to connect!).
- Ask Questions & Share Ideas: Discord
- Contribute: Contribution Guide
- Report Bugs & Request Features: GitHub Issues
We're incredibly excited to see what you build with VoltAgent. Let's redefine AI development for JavaScript together!
The VoltAgent Team