VoltOps Tracing
Tracing shows how a single user request runs from start to finish. As a developer, you use it to answer:
- Why did the agent respond this way?
- Which step failed?
- Where did latency or cost spike?
When you select a trace from the list, you can open the Waterfall view or the Node-Based view and then dig into Logs and Feedback.
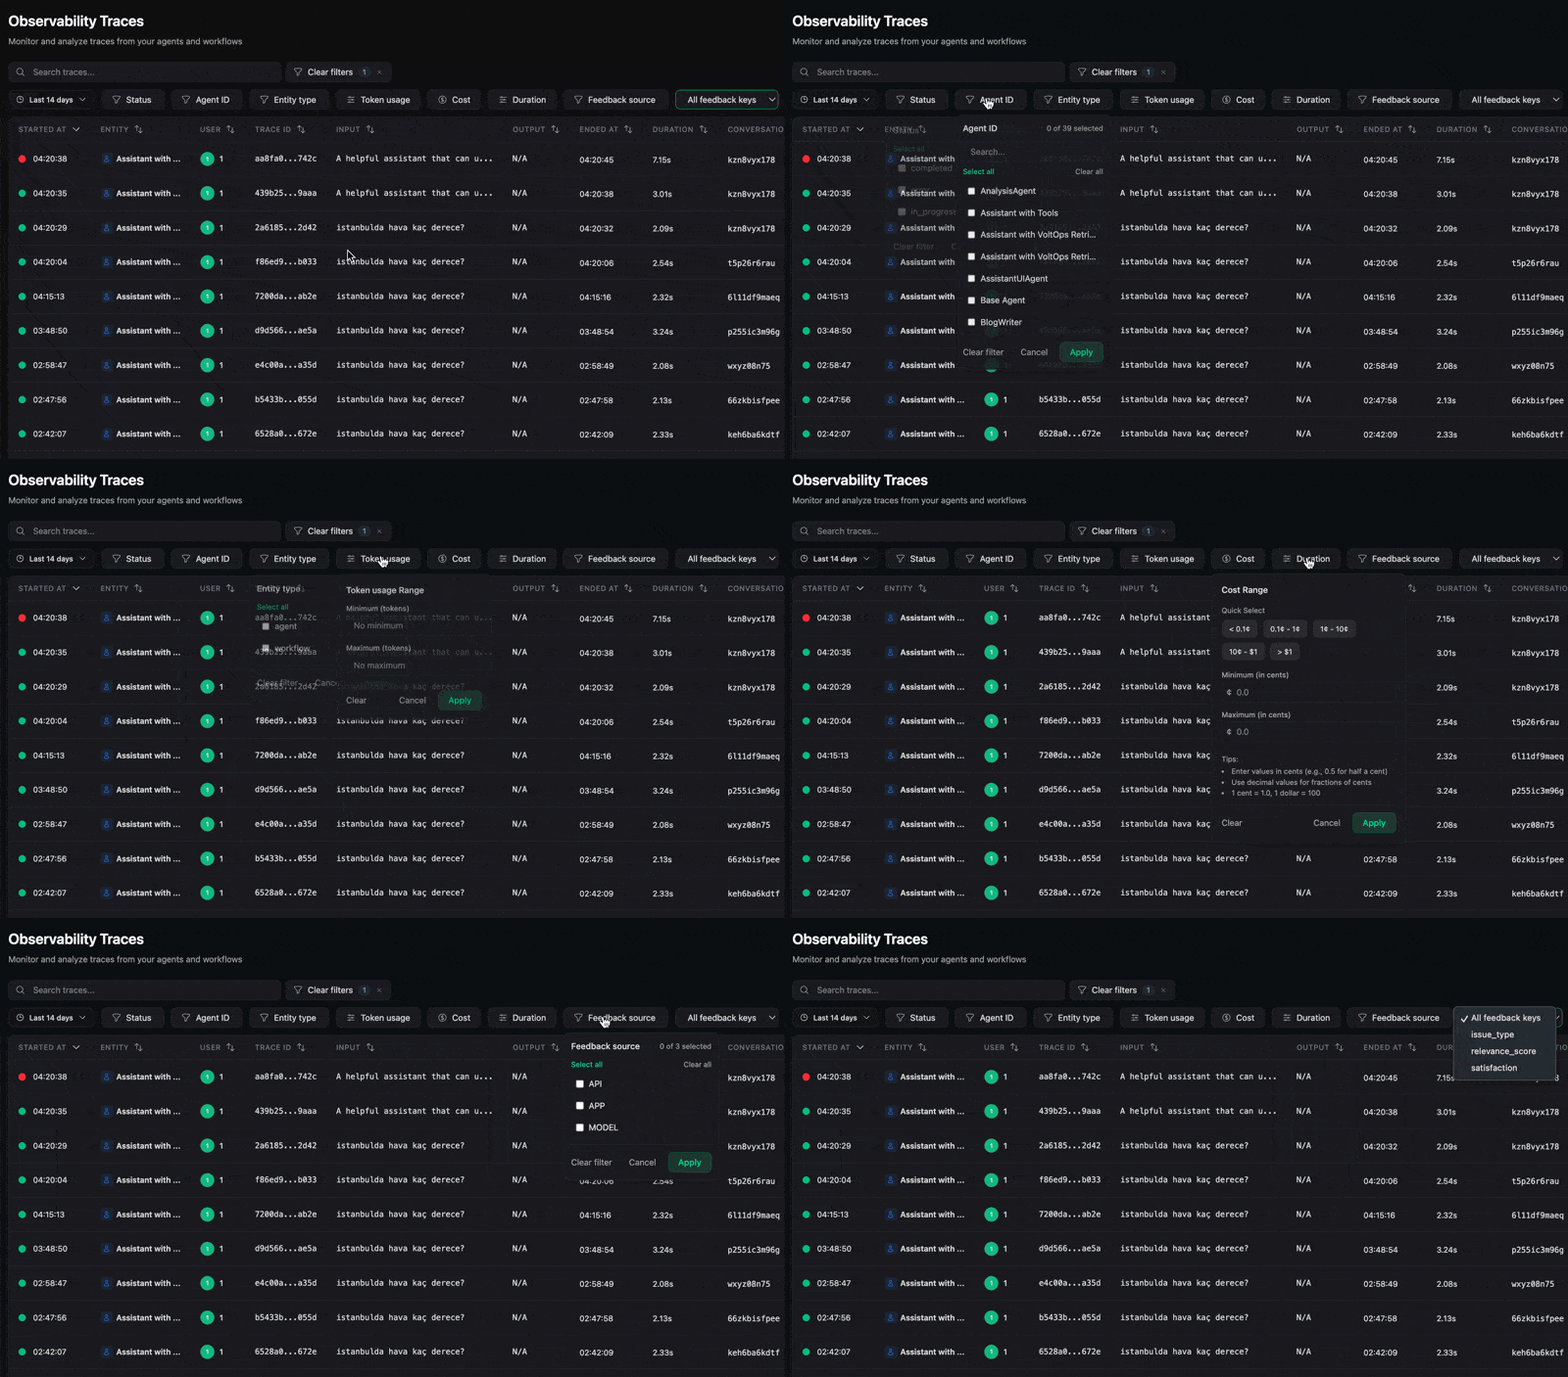
Trace Filters
Filters help you find the right trace fast.
tip
For example use:
- Status + Duration to see where a failure started,
- Token usage + Cost to catch expensive runs, and
- User ID + Conversation ID to inspect a specific user flow.

- Status: isolate failed or retry-heavy runs.
- Agent ID / Entity type: narrow down which agent or step is involved.
- Token usage / Cost: find expensive or abnormal runs.
- Duration: spot slow traces and latency outliers.
- Feedback source / key: review feedback by source.
- User ID / Conversation ID: drill into one user journey.