User Analytics
The Users page groups traces by user so you can see who is impacted and where issues concentrate. It helps you go from "something feels off" to a specific user, session, and trace.
Key Metrics
Quick read of volume, success rate, latency, and cost over time. Use it to decide if the problem is quality, performance, or spend, and to link regressions to model switches.
User Feedback
Feedback turns user sentiment into signals you can track. Use it to confirm whether fixes improved the experience and to see which issues users feel most.
Use the charts to see feedback volume, sentiment trends, score clusters, dominant feedback keys, and when users leave comments.
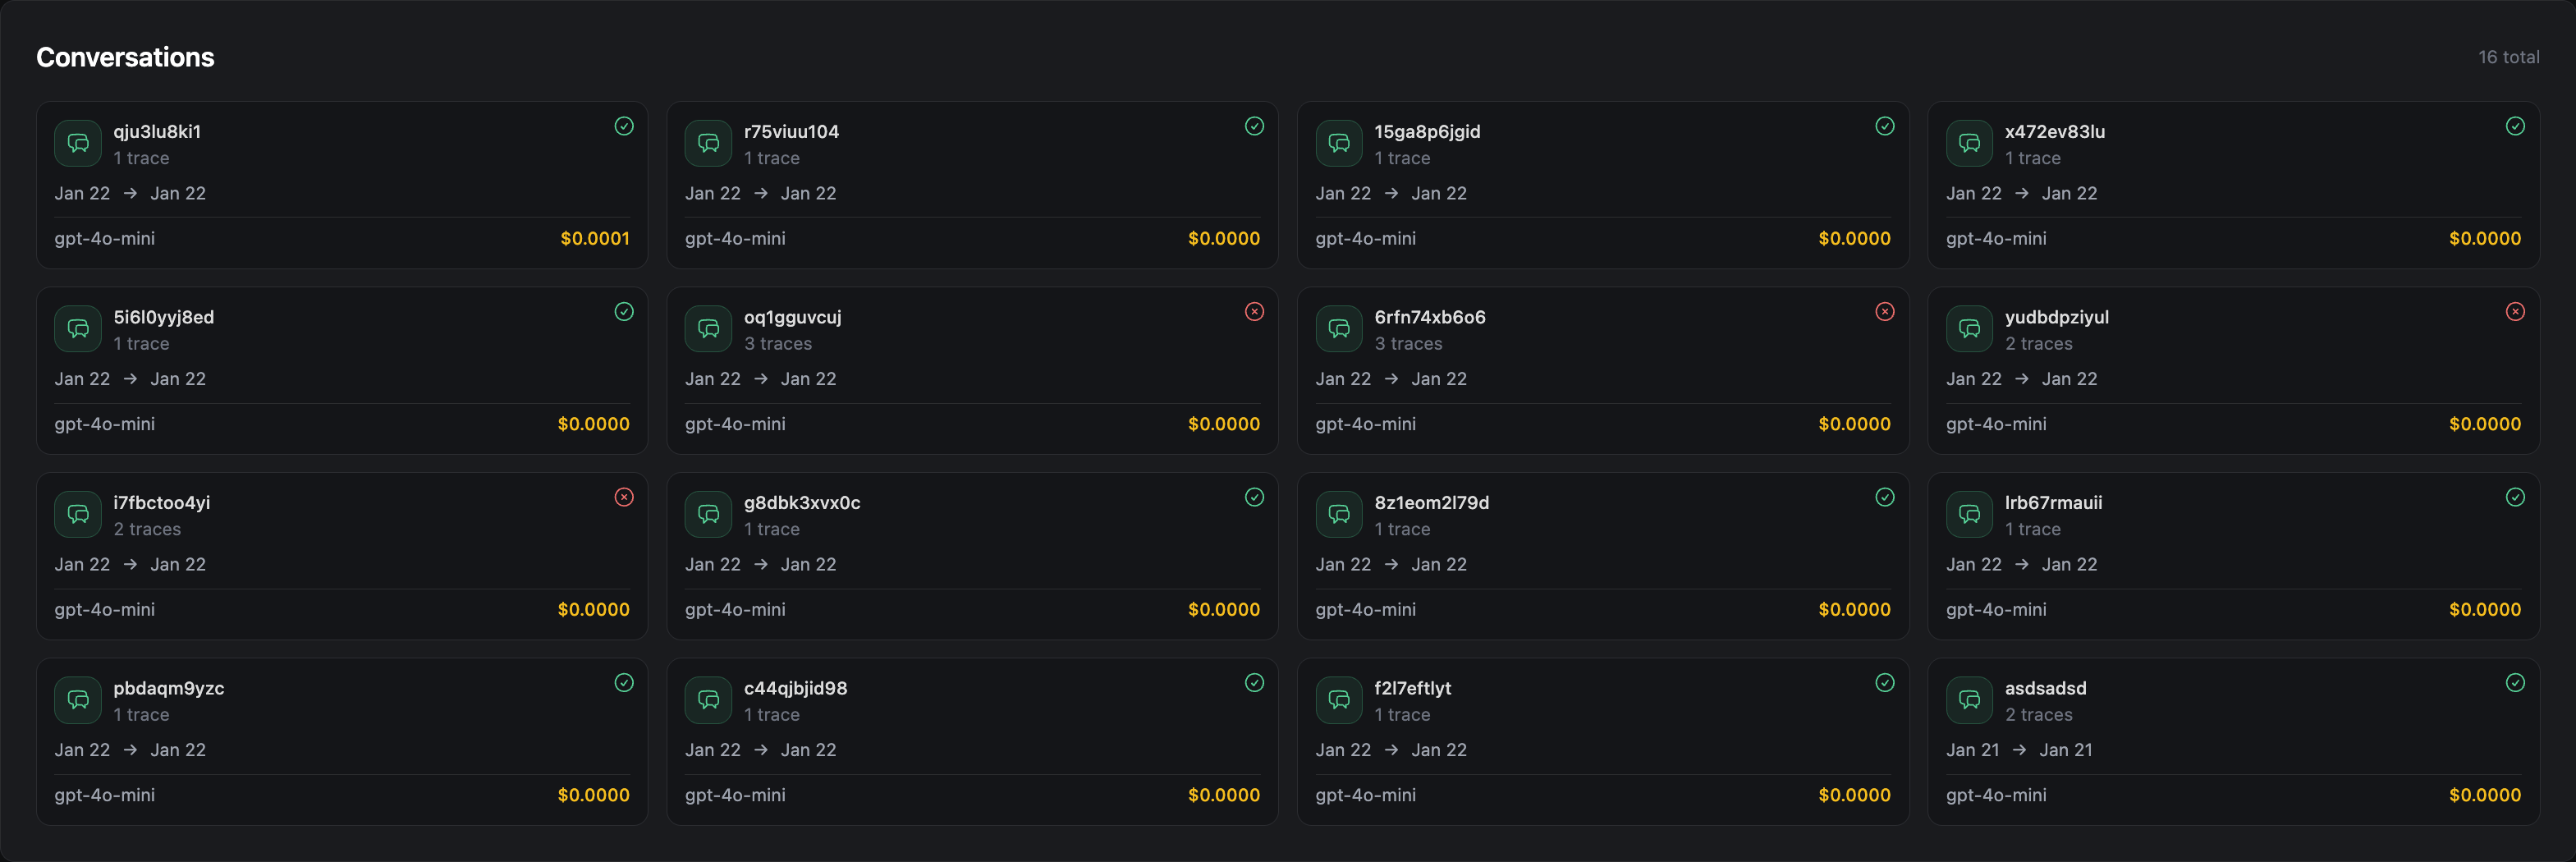
Conversations
Conversations group traces by session so you can follow a user flow end to end.
Use the cards (status, time range, model, cost) to pick the most suspicious session, then filter traces to that path.