MLflow Integration
VoltAgent ships with an OpenTelemetry-based observability layer. You can export spans directly to MLflow using standard OpenTelemetry packages — no additional wrapper needed. MLflow's OTLP endpoint ingests VoltAgent traces and renders them with rich span-type icons, chat UI, and token usage summaries.
Prerequisites
- An MLflow server running and accessible. You can set one up locally (via pip, Docker Compose, etc.) or use a managed service like Databricks, AWS SageMaker, and more.
- A basic VoltAgent application setup.
Installation
Install the OpenTelemetry SDK and OTLP protobuf exporter:
npm install @opentelemetry/sdk-trace-base @opentelemetry/exporter-trace-otlp-proto
Setup
Configure VoltAgent
In your application (e.g., src/index.ts) import the observability class and the OpenTelemetry packages:
import { Agent, VoltAgent, VoltAgentObservability } from "@voltagent/core";
import { BatchSpanProcessor } from "@opentelemetry/sdk-trace-base";
import { OTLPTraceExporter } from "@opentelemetry/exporter-trace-otlp-proto";
Create a VoltAgentObservability instance and attach the MLflow exporter:
const mlflowExporter = new OTLPTraceExporter({
  url: `${process.env.MLFLOW_TRACKING_URI}/v1/traces`,
  headers: {
    "x-mlflow-experiment-id": process.env.MLFLOW_EXPERIMENT_ID ?? "0",
  },
});

const observability = new VoltAgentObservability({
  spanProcessors: [new BatchSpanProcessor(mlflowExporter)],
});

const agent = new Agent({
  name: "my-voltagent-app",
  instructions: "A helpful assistant",
  model: "openai/gpt-4o-mini",
});

new VoltAgent({
  agents: { agent },
  observability,
});
Add the required environment variables to your .env file:
OPENAI_API_KEY=your-api-key
MLFLOW_TRACKING_URI=http://localhost:5000
MLFLOW_EXPERIMENT_ID=0
Run and View Traces
Start the VoltAgent development server:
npm run dev
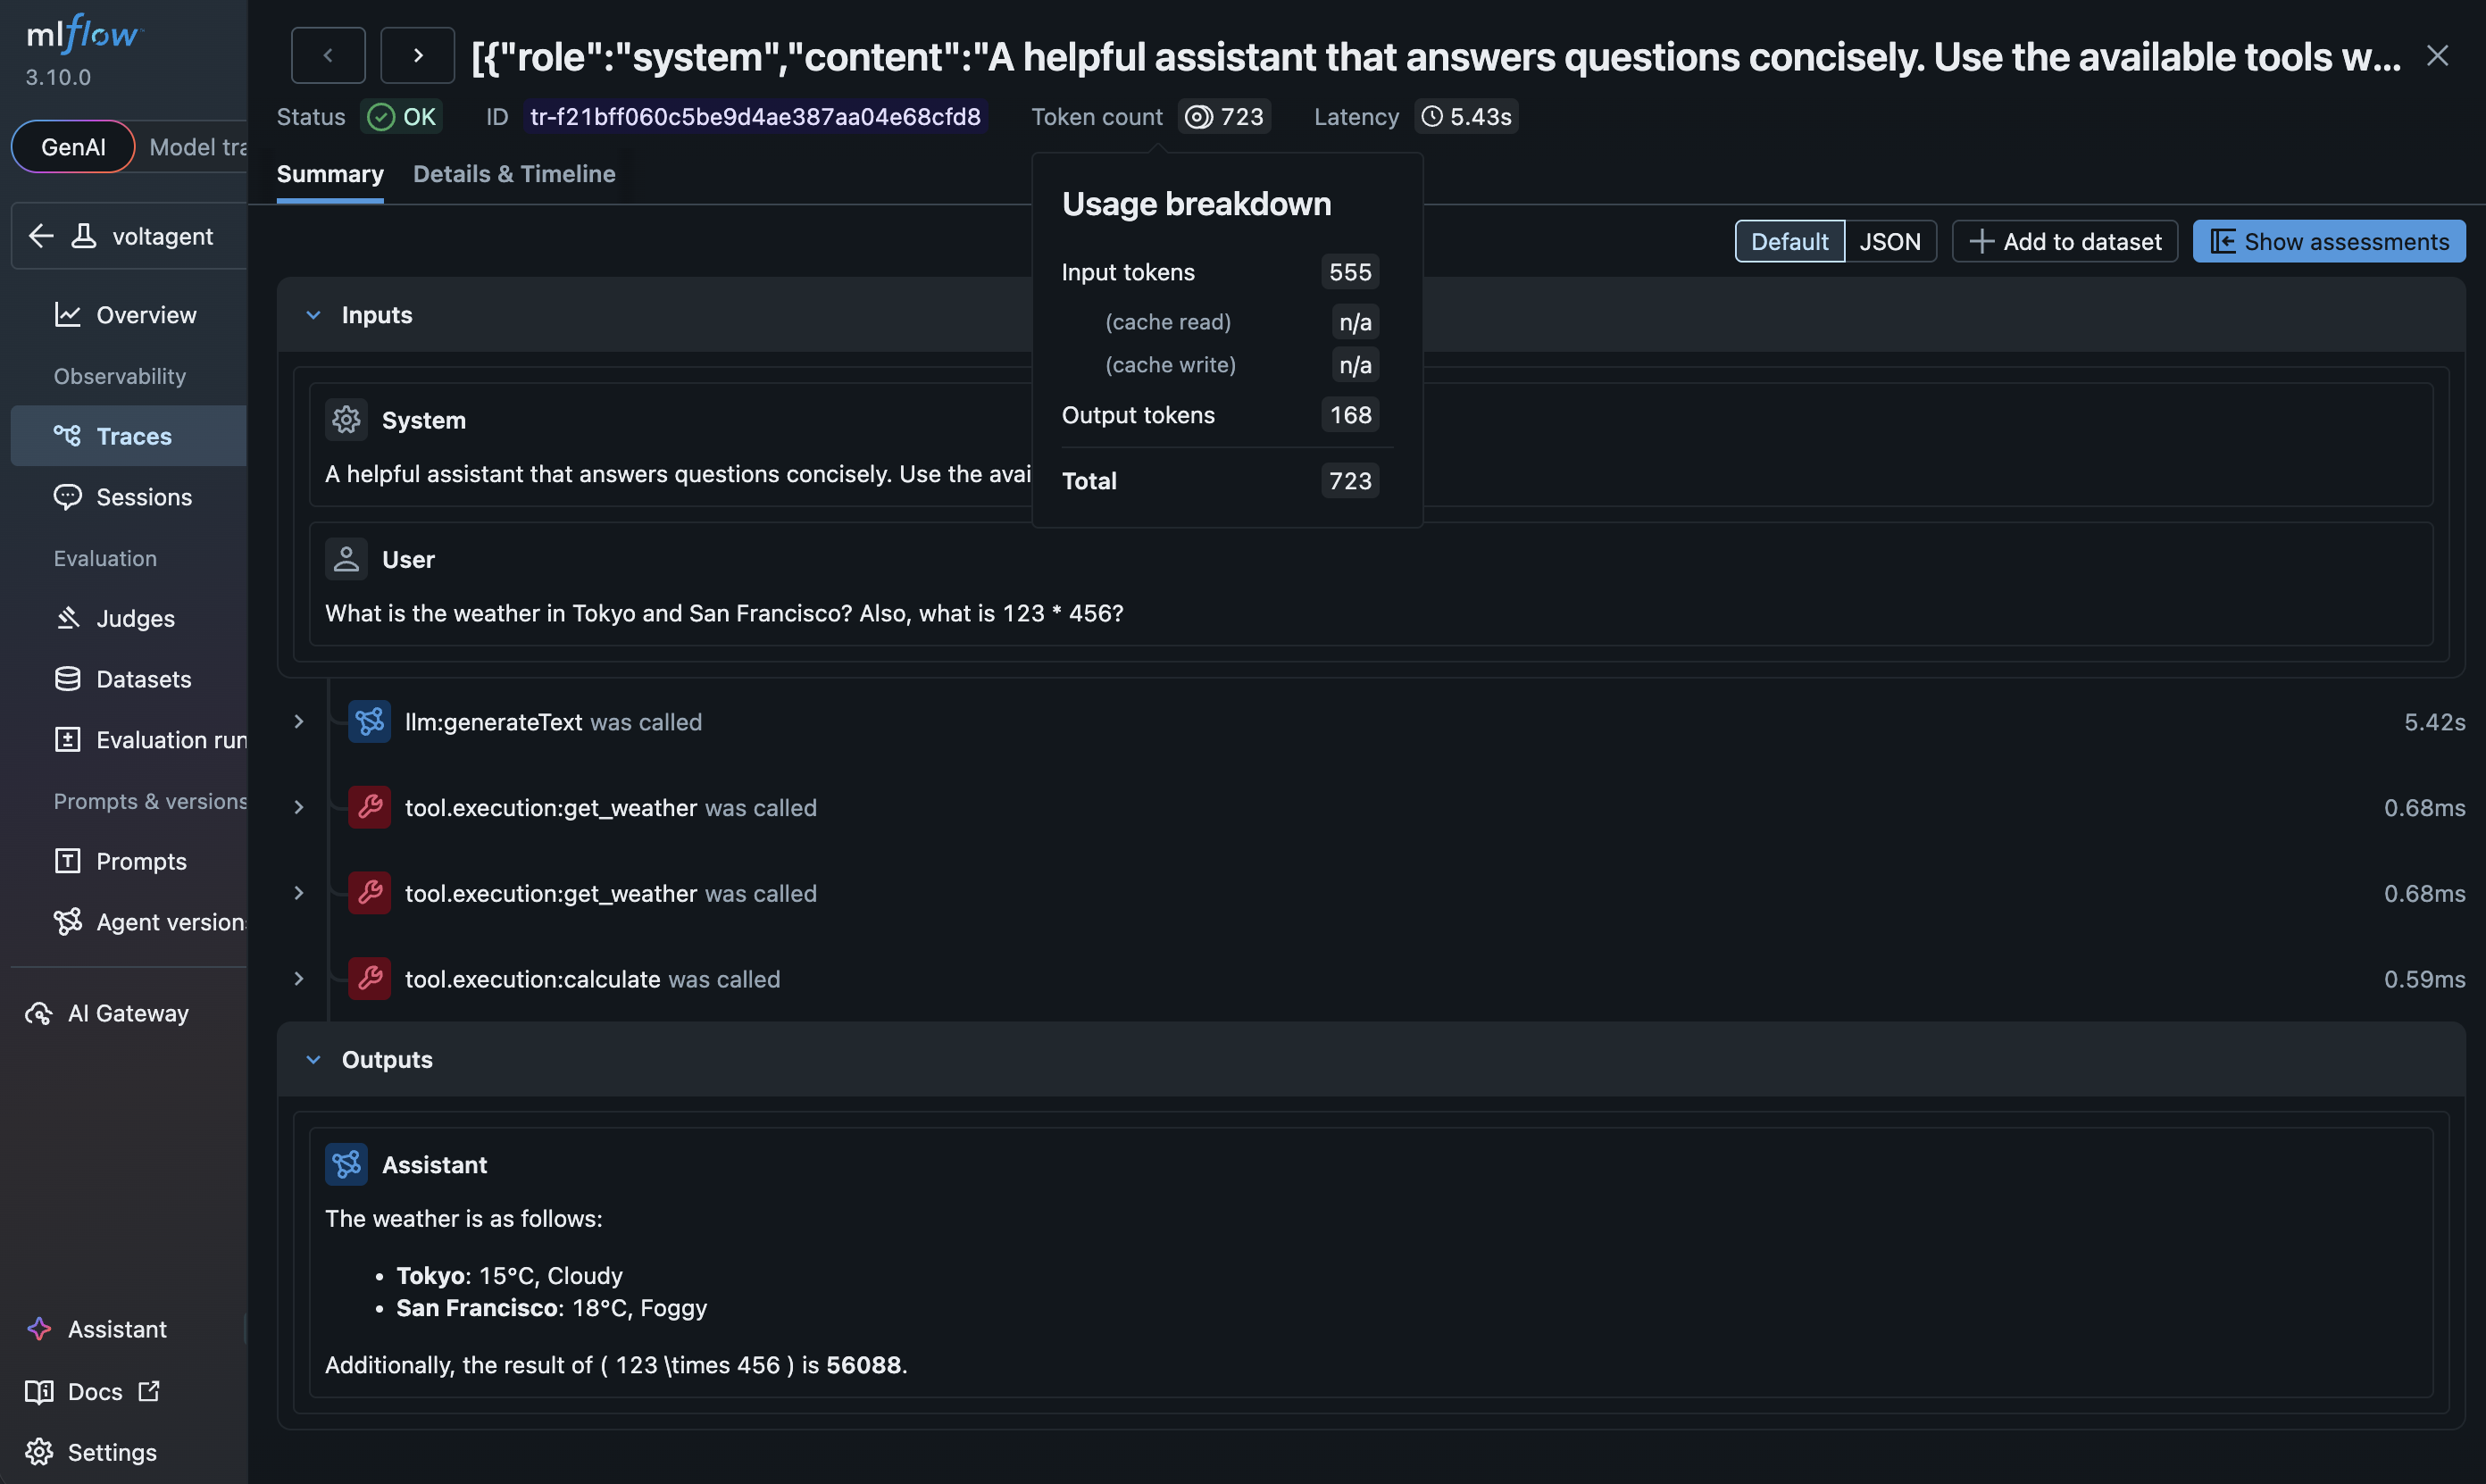
Interact with your agent via the VoltAgent Console, then open the MLflow UI at http://localhost:5000 to see your traces.
How it Works
- VoltAgent initializes a global OpenTelemetry tracer provider.
- The standard
OTLPTraceExportersends spans to MLflow's/v1/tracesendpoint via OTLP/HTTP (protobuf). - MLflow automatically translates VoltAgent's semantic conventions for optimal visualization — mapping agent, LLM, tool, and memory spans to dedicated span types, extracting token usage metrics, and rendering chat messages in a rich UI.
- All agent and workflow spans flow through the observability pipeline, giving you end-to-end visibility into your agent's execution.
Learn More
- MLflow Tracing — Full tracing guide including evaluation, prompt management, and more.
- MLflow OpenTelemetry Integration — Details on MLflow's OpenTelemetry support.
- MLflow VoltAgent Guide — Step-by-step setup tutorial with screenshots.